Blueprints in Arc Raiders don't come with a convenient in-game guide telling you exactly where to look. The game tells you a blueprint can appear on a given map, but not which building, which floor, or which container type gives you the best shot. That gap has spawned a growing ecosystem of community-built tracking tools — and the most prominent one, ArcBlueprintTracker, now overlays crowdsourced blueprint find data directly onto interactive maps as color-coded heat maps.
Quick answer: Blueprint heat maps on arcblueprinttracker.io aggregate player-submitted reports to show where on each map specific blueprints have been found most frequently, with red zones indicating the highest density of reports.
What the heat map actually shows
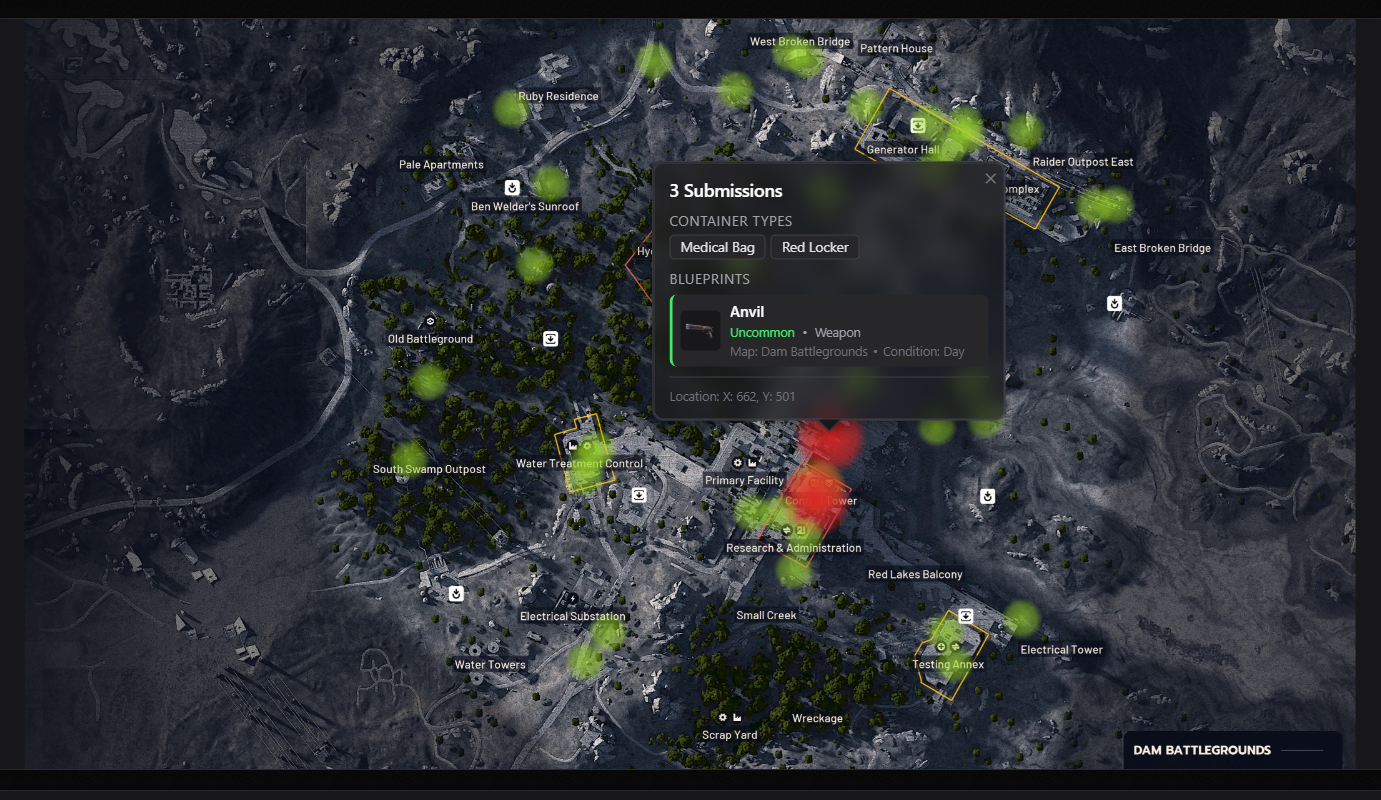
The heat map layer on ArcBlueprintTracker plots individual player submissions — each one recording a blueprint name, the map it was found on, the specific location within that map, and the container type it came from. When enough reports cluster in the same area, the overlay shifts from green (low density) through yellow (medium) to red (high density). The site currently holds nearly 3,800 total submissions spread across all five maps: Dam Battlegrounds, The Spaceport, Buried City, The Blue Gate, and Stella Montis.
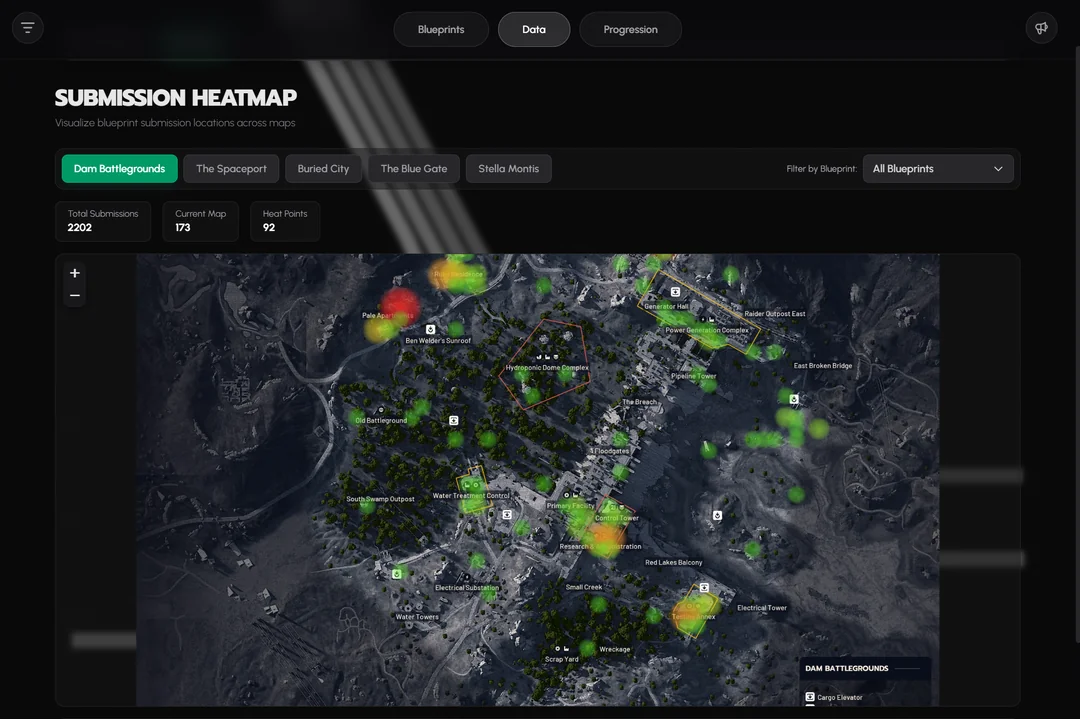
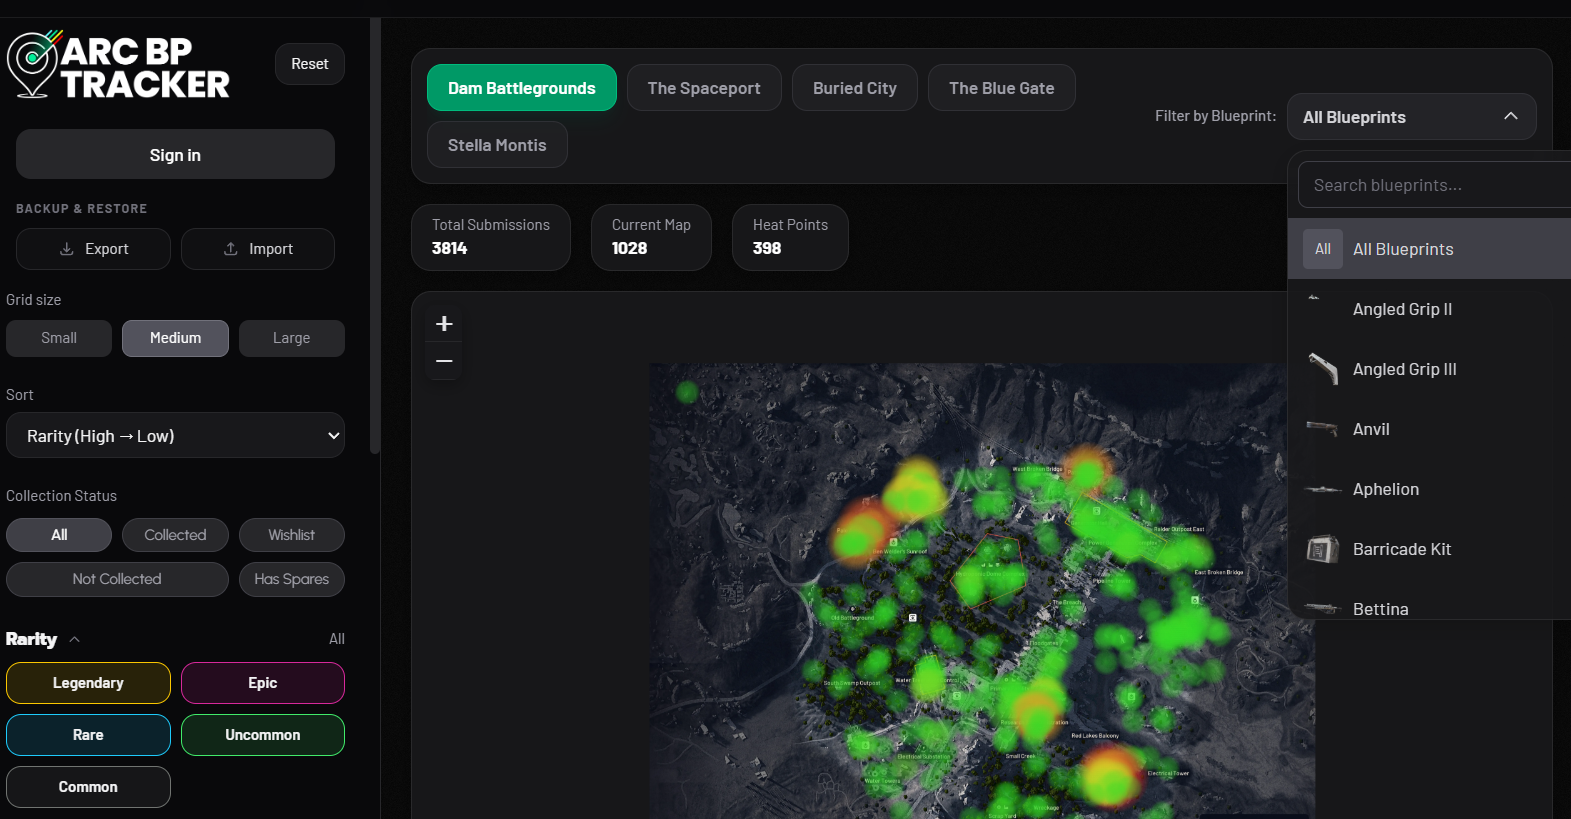
You can filter the heat map by a single blueprint. This is the tool's most practical use. Instead of viewing all reports at once, selecting a specific blueprint — say, the Venator on Dam Battlegrounds — narrows the overlay to only the 22 submissions for that weapon on that map, making it much easier to identify where players have had success.
How blueprint spawns work in Arc Raiders
Before relying on any heat map, it helps to understand the underlying spawn logic. Blueprints in Arc Raiders are not purely random. They are tied to container types first, and map location second. A medical-style container (white pullout drawers, blue hospital drawers) can drop Vita Spray, Vita Shot, or Defib blueprints regardless of whether it sits in a designated medical zone. An identical container in a residential hallway follows the same loot table. The zone around a container mostly determines which container types appear there — a hospital has more medical containers, so it naturally yields more medical blueprints.
This distinction matters for interpreting heat maps. A red hotspot on Buried City's hospital doesn't necessarily mean the game favors that building for medical blueprints. It means that building is packed with medical containers, so players loot there more and report more finds. The heat map reflects container density and player traffic as much as it reflects any hidden spawn weighting.
The major container-to-blueprint groupings break down roughly like this:
| Container Type | Blueprint Categories | Examples |
|---|---|---|
| Medical (white drawers, blue hospital drawers, med bags) | Medical items, augments | Vita Spray, Vita Shot, Defib, Mk.3 augments |
| Raider (caches, backpacks, ammo boxes, weapon boxes, grenade cases) | Weapons, gun parts | Anvil, Venator, Osprey, Torrente, Heavy Gun Parts |
| Residential (trash cans, wardrobes, suitcases, cupboards) | Level 2 attachments, Vertical Grip III | Angled Grip II, Extended Medium Magazine III |
| Industrial (red lockers in industrial zones, shipping containers, breachable rusty boxes) | Explosives | Trigger Nade, Pulse Mine |
| Electrical (server cabinets, computers, breachable wall cabinets, androids) | Utility items | Tagging Nade, Remote Raider Flare, Barricade |
| Augment boxes (black boxes, black lockers, small security lockers) | Augments, Complex Gun Parts | Looting Mk.3, Combat Mk.3, Complex Gun Parts |
Some blueprints are also locked behind specific map conditions or events. The Bobcat only spawns during the Locked Gate event. The Vulcano requires the Hidden Bunker event. Tempest and Wolfpack appear exclusively during Night Raids. The Snap Hook drops only inside the electromagnetic storm during that event. These restrictions mean heat map data for event-specific blueprints will naturally cluster on the maps and conditions where those events occur.
Strengths and blind spots of crowdsourced data
The heat map is only as reliable as the players feeding it. Several biases are worth keeping in mind when you plan a run around it.
Traffic bias is the biggest factor. Popular routes get looted more, so they generate more reports. A red zone on the heat map might simply be the path most players take after spawning, not a location with better drop rates. Pale Apartments on Dam Battlegrounds, for example, shows up as a deep red hotspot — but it's a high-density container area, not a high-value one. More containers means more chances, which means more reports, which means a redder heat map.
Reporting bias also skews the picture. Players are far more likely to submit a find for a sought-after blueprint like the Snap Hook or Looting Mk.3 (Survivor) than for a common attachment they already own three copies of. This can make rare blueprints appear artificially concentrated in specific spots while common ones look underrepresented.
Low sample sizes affect less popular maps and blueprints. A single submission for a Tempest blueprint on The Spaceport creates a yellow dot that might look meaningful but represents exactly one player's experience. The site does not currently normalize data by the number of times a container has been looted versus how often it yielded a blueprint, so a locked room that gets opened less frequently will show fewer reports even if its per-open drop rate is higher.
The tool's rarity tiers reflect this reality. Rarity on the tracker is a heuristic, not a true in-game drop rate. A blueprint classified as "Legendary" simply has fewer than 10 community reports, while "Common" means over 100 reports across five or more maps.
Using the heat map effectively
Step 1: Go to arcblueprinttracker.io/data/heatmap and select the map you plan to raid. The site covers all five current maps.
Step 2: Use the "Filter by Blueprint" dropdown to isolate the specific blueprint you're hunting. Viewing all blueprints at once produces a general container-density overlay that isn't very actionable for targeted farming.
Step 3: Cross-reference the heat map's hotspots with your knowledge of container types. If you're hunting a weapon blueprint like the Anvil, focus on areas where the heat map overlaps with raider-style containers — caches, ammo boxes, weapon boxes. If you're after an augment, prioritize spots near medical containers, black boxes, and security lockers.
Step 4: Factor in map conditions. If the blueprint you want is event-locked (Bobcat on Locked Gate, Vulcano on Hidden Bunker, Tempest or Wolfpack on Night Raid), wait for the right event before committing to a farming session. The heat map won't help much if the event isn't active.
Tip: Uncovered Caches events offer a noticeably higher blueprint drop rate from raider caches — roughly estimated at around 10 percent per cache. If you're chasing weapon or gun-part blueprints, these events are worth prioritizing over standard day raids.
Other community tracking tools
ArcBlueprintTracker isn't the only option. A separate tool called the Blueprint Atlas, built by community member Roxban, offers a live database of player-reported finds with a different interface. It displays a rolling feed of the most recent community submissions, each tagged with the blueprint name, map, map condition (day, night, storm), container type, and a text description of the location. Users can sign in to vote on submissions, which helps surface reliable reports. The Atlas uses the same heuristic rarity tiers and carries a similar caveat about bias toward popular routes and frequently opened container types.
Both tools draw on data originally cataloged by content creator TheGamingMerchant, whose extensive testing across thousands of blueprint finds established much of the community's understanding of container-type loot tables and event-specific restrictions.
What heat maps can't tell you
No community tool can reverse-engineer Arc Raiders' actual drop-rate tables. The game uses pseudo-random number generation for loot, and while patterns emerge at scale, a heat map cannot guarantee that visiting a red zone will produce a blueprint. It can tell you where other players have had luck, and it can help you identify areas dense with the right container types — but the final roll is still random.
The developers at Embark Studios have not published official drop rates or confirmed whether certain locations carry hidden spawn-rate bonuses. Until that changes, community tools remain the best approximation available, and they work best when treated as trend indicators rather than definitive spawn guides. The more players submit accurate reports, the sharper the picture becomes — but the underlying randomness means no heat map will ever turn blueprint hunting into a sure thing.