
NDIS (Network Driver Interface Specification) traces or logs provide valuable insights into network driver activities, helping you identify and resolve network-related issues on Windows systems. By examining these logs, you can pinpoint driver errors, network latency problems, and connectivity failures. Here's how you can access and analyze Windows NDIS traces or logs effectively.
Method 1: Using Microsoft Message Analyzer (Recommended)
Step 1: Download and install Microsoft Message Analyzer from the official Microsoft website. Although the tool has been deprecated, it remains highly effective for analyzing NDIS logs. After installation, launch the application from your Start menu.
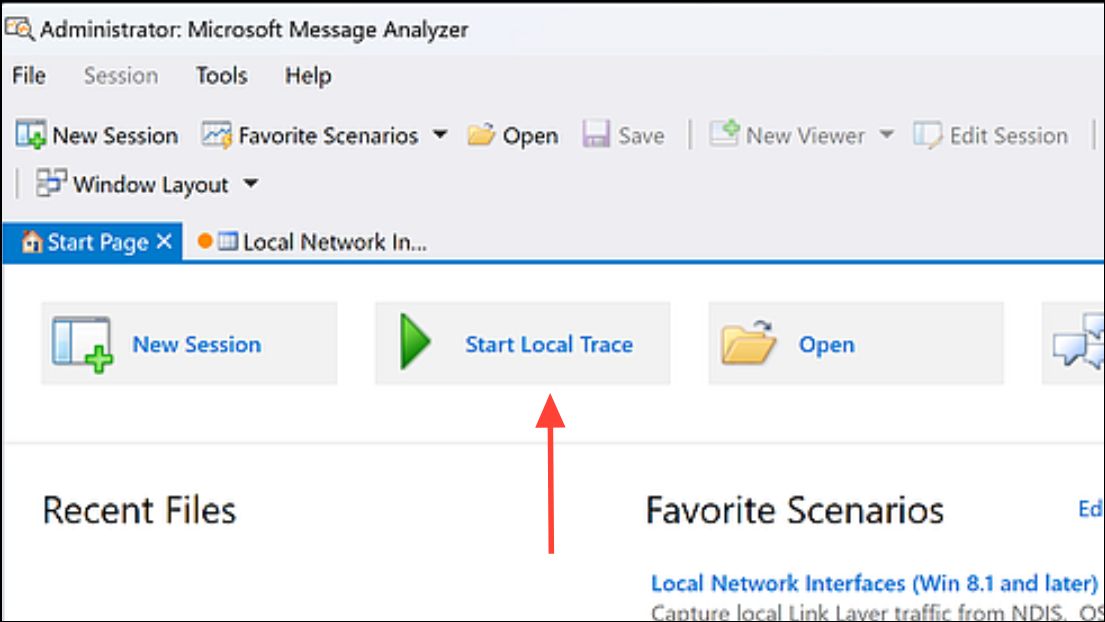
Step 2: In the Message Analyzer interface, click on "File" and select "Capture/Trace". Next, click on "Start Local Trace" to initiate capturing network events. By default, Message Analyzer captures data from various channels, including NDIS.
Step 3: Reproduce the network issue you're investigating. Once sufficient data has been captured, click "Stop" to halt the trace.
Step 4: The captured trace appears in the main pane. To focus specifically on NDIS events, apply a filter by typing NDIS into the filter box at the top. This simplifies the view, allowing you to quickly identify relevant network driver events.
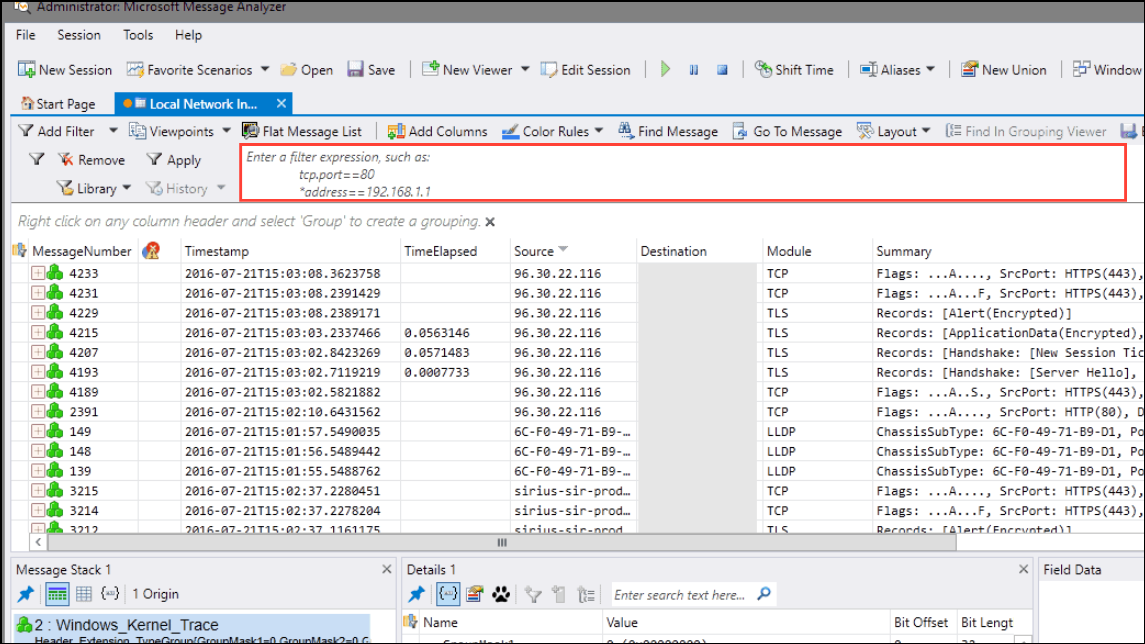
Step 5: Analyze the results by examining event details, timestamps, and error messages. Message Analyzer provides detailed event information, helping you diagnose the root cause of network issues.
Method 2: Utilizing netsh Command-Line Utility
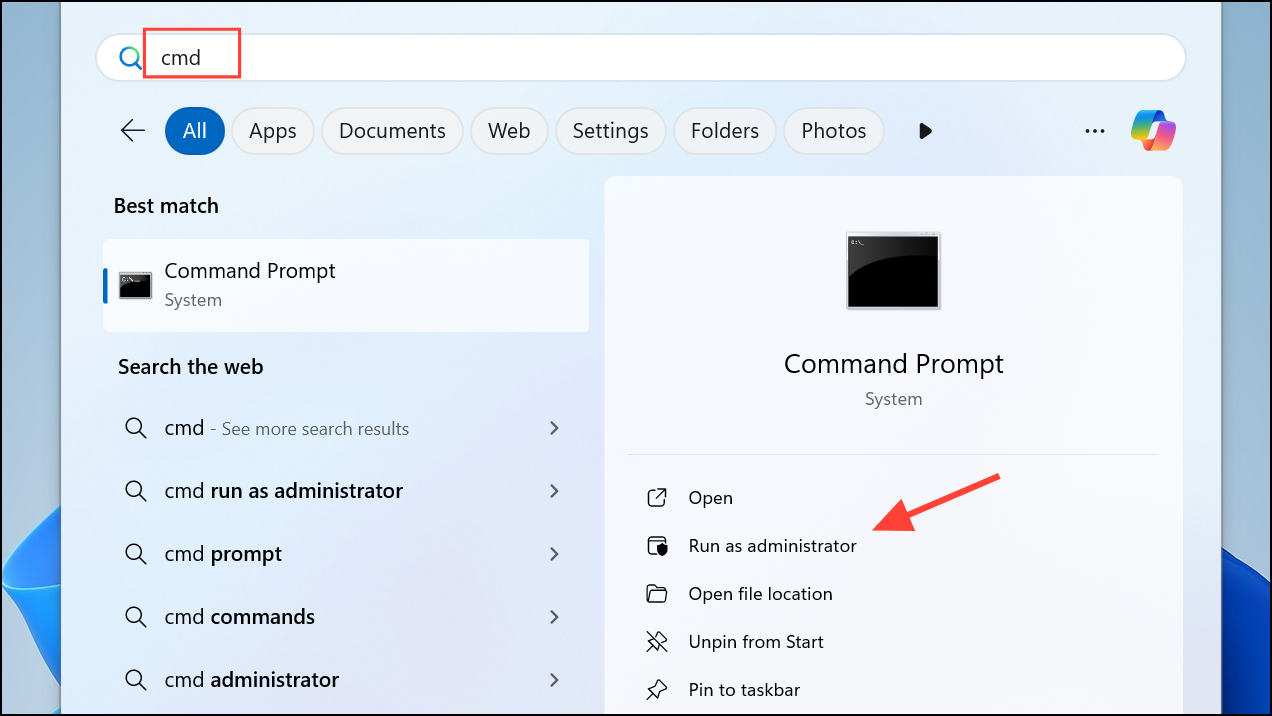
Step 1: Open an elevated Command Prompt. Press Win + S, type "cmd", right-click on "Command Prompt", and select "Run as administrator".
Step 2: Start capturing NDIS logs by entering the following command:
netsh trace start capture=yes tracefile=C:\temp\ndis_trace.etl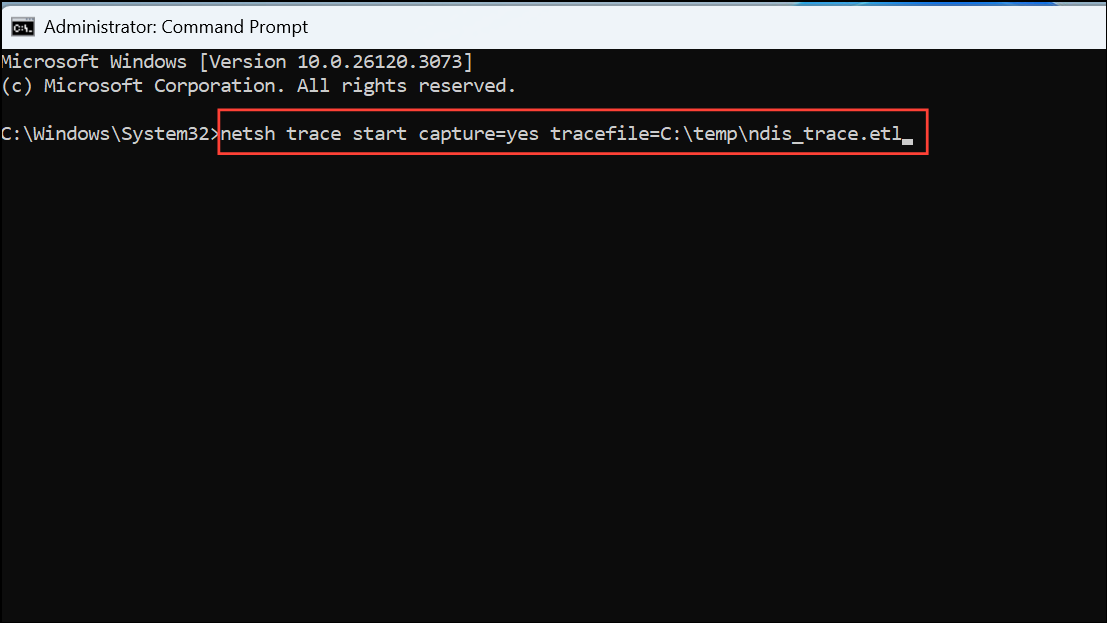
This command initiates tracing network events and saves the output to the specified file path. You can modify the path as needed.
Step 3: Reproduce the network issue or perform the actions you want to analyze. Allow the trace to run for the necessary duration.
Step 4: Stop the trace by entering:
netsh trace stop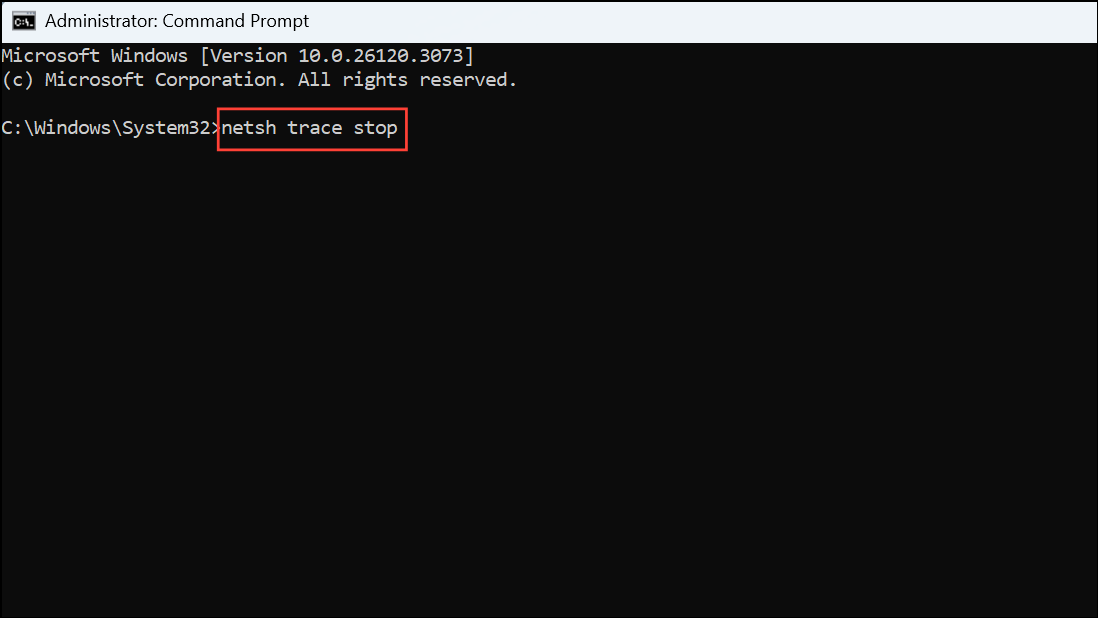
The generated trace file (ndis_trace.etl) is now ready for analysis.
Step 5: Open the ETL file in Microsoft Message Analyzer or Windows Performance Analyzer (WPA) for detailed inspection. These tools allow in-depth analysis of recorded NDIS events, helping you identify problematic network drivers or connectivity issues.
Method 3: Viewing NDIS Logs in Event Viewer
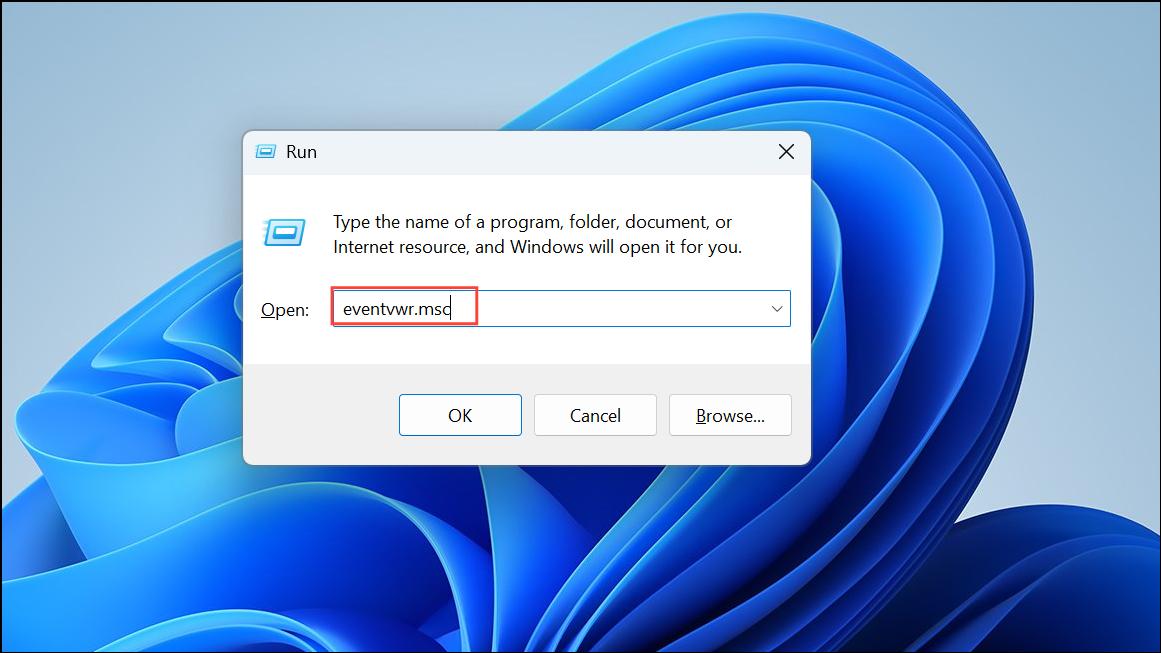
Step 1: Press Win + R, type eventvwr.msc, and hit Enter to open the Windows Event Viewer.
Step 2: In the left pane, navigate to Applications and Services Logs > Microsoft > Windows > NDIS. Expand the NDIS folder and select "Operational".
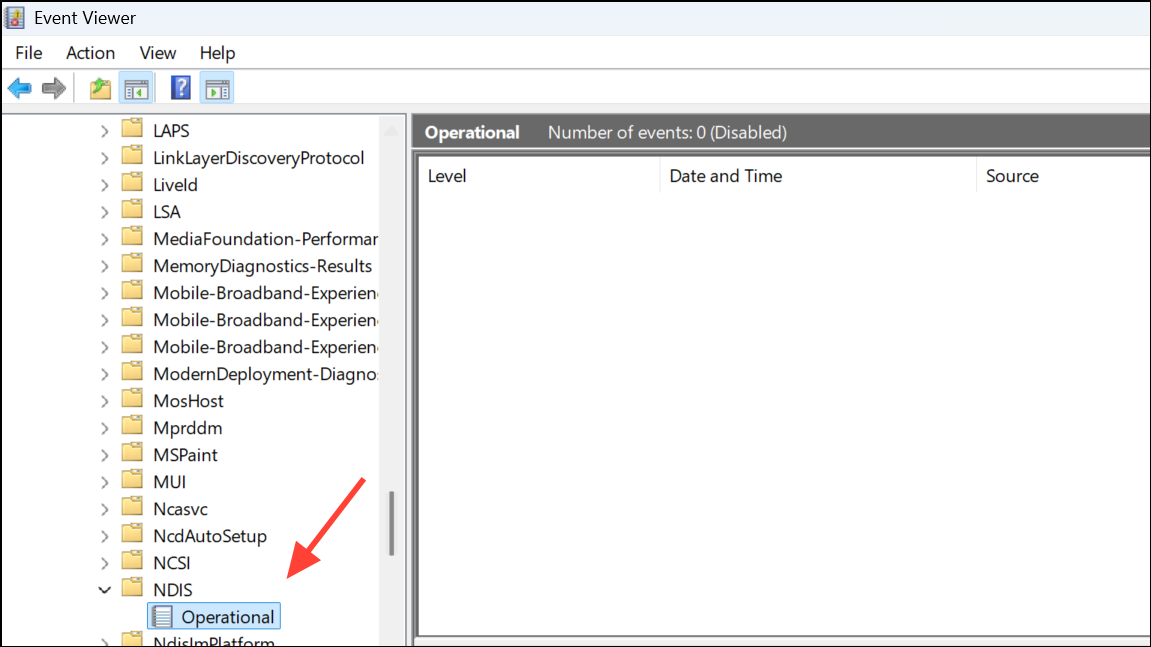
Step 3: Review the event logs displayed in the central pane. These logs contain detailed information about NDIS events, including warnings, errors, and informational messages.
Step 4: Click on individual events to see detailed descriptions, timestamps, and error codes. Use this information to diagnose network issues or driver malfunctions.
Step 5: If needed, you can export the logs by right-clicking the "Operational" log, selecting "Save All Events As...", and choosing a convenient file format, such as CSV or XML, for further analysis.
Regularly checking NDIS logs can significantly simplify the troubleshooting of network issues. Keep these methods handy to quickly identify and resolve network driver problems on your Windows systems.