
Probability is a mathematical measure that defines the probable chances of an event (or set of events) occurring in a situation. In other words, it is simply how likely something is to happen. The probability of an event is measured by comparing the number of favorable events with the total number of possible outcomes.
For example, when we toss a coin, the chance of getting a ‘head’ is half (50%), so is the probability of getting a ‘tail’. Because the total number of possible outcomes is 2 (a head or tail). Suppose, your local weather report says there’s an 80% chance of rain, then it will probably rain.
There are numerous applications of probability in daily life like sports, weather prediction, polls, card games, predicting the sex of the baby in the womb, statics, and many more.
Calculating probability can seem like a daunting process, but MS Excel provides a built-in formula to easily calculate probability using the PROB function. Let us see how to find probability in Excel.
Calculate Probability using the PROB function
Usually, the probability is calculated by dividing the number of favorable events by the total number of outcomes possible. In Excel, you can use the PROB function to measure the probability for an event or range of events.
The PROB function is one of the statistical functions in Excel that calculates the probability that the values from a range are between specified limits. The syntax of the PROB function is as follows:
= PROB(x_range, prob_range, [lower_limit], [upper_limit])where,
- x_range: This is the range of numeric values that shows different events. The x values have associated probabilities.
- prob_range: This is the range of probabilities for each corresponding value in the x_range array and the values in this range must add up to 1 (If they are in percentages must add upto 100%).
- lower_limit (optional): It is the lower limit value of an event for which you want the probability.
- upper_limit (optional): It is the upper limit value of an event for which you want the probability. If this argument is ignored, the function returns the probability associated with the value of lower_limit.
Probability Example 1
Let’s learn how to use the PROB function using an example.
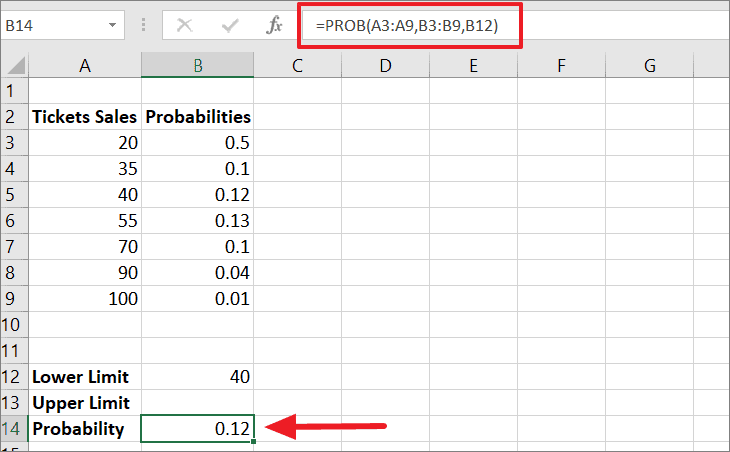
Before you start calculating probability in Excel, you should prepare the data for calculation. You should enter the date into a probability table with two columns. A range of numerical values should be entered in one column and their associated probabilities in another column as shown below. The sum of all probabilities in column B should be equal to 1 (or 100%).
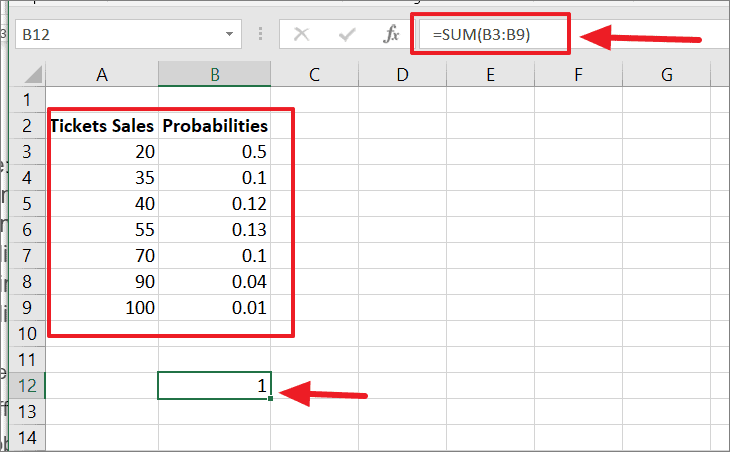
Once the numerical values (Ticket Sales) and their probabilities of getting them are entered, you can use the SUM function to check whether the sum of all probabilities adds up to ‘1’ or 100%. If the total value of probabilities is not equal to 100%, the PROB function will return the #NUM! error.
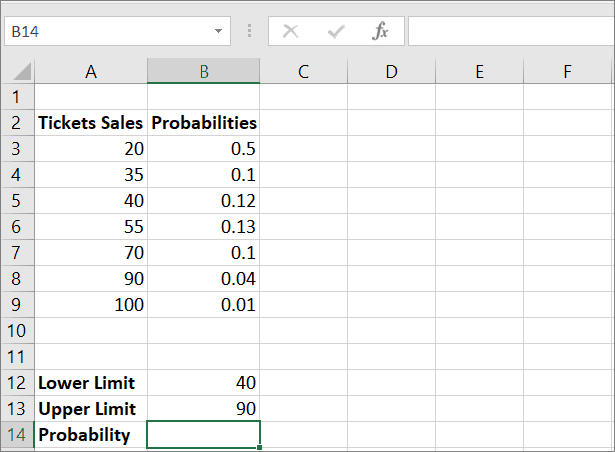
Let’s say we want to determine the probability that ticket sales are between 40 and 90. Then, enter the upper limit and lower limit data into the sheet as shown below. The lower limit is set to 40 and the upper limit is set to 90.
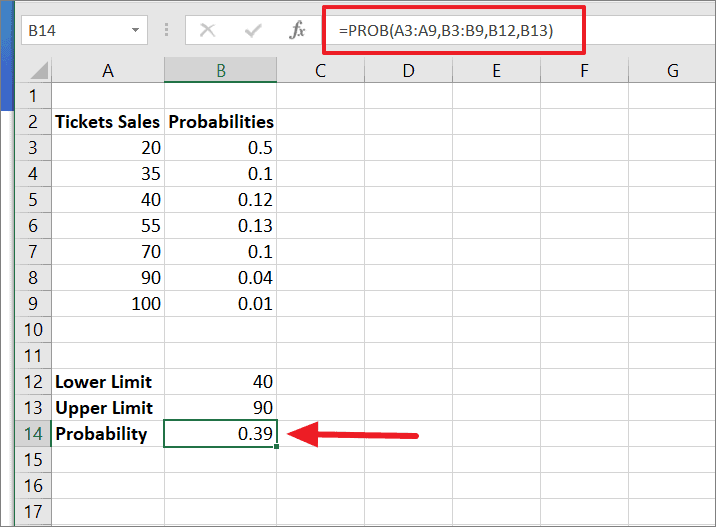
To calculate the probability for the given range, enter the below formula in cell B14:
=PROB(A3:A9,B3:B9,B12,B13)Where A3:A9 is the range of events (ticket sales) in numerical values, B3:B9 contains the chance of getting the respective sales quantity from column A, B12 is the lower limit, and B13 stands for the upper limit. As a result, the formula returns the probability value of ‘0.39’ in cell B14.
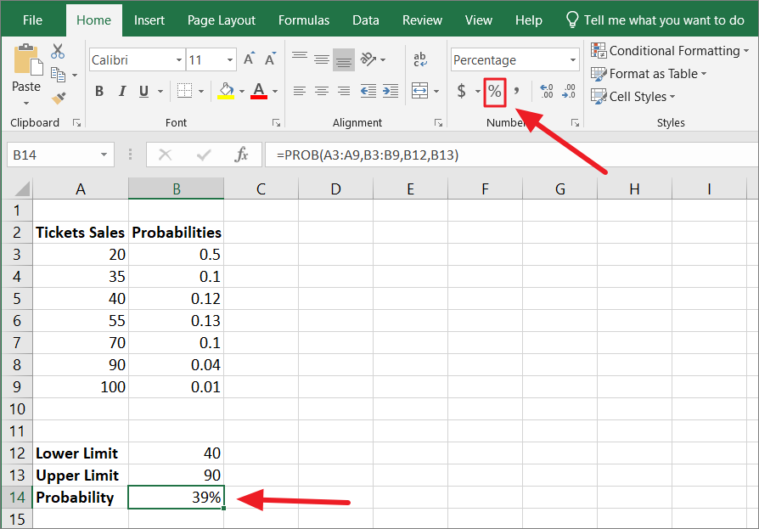
Then, click on the ‘%’ icon in the Number group of the ‘Home’ tab as shown below. And you will get ‘39%’, which is the probability of making the ticket sales between 40 and 90.
Calculating the Probability Without Upper Limit
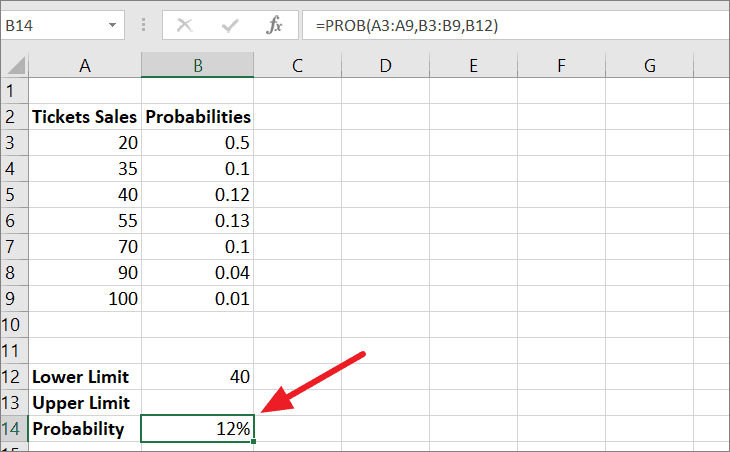
If the upper limit (last) argument is not specified, the PROB function returns the probability equal to the value of lower_limit.
In the below example, the upper_limit argument (last) is omitted in the formula, the formula returns ‘0.12’ in cell B14. The result is equal to ‘B5’ in the table.
When we convert it to percentage, we’ll get ‘12%’.
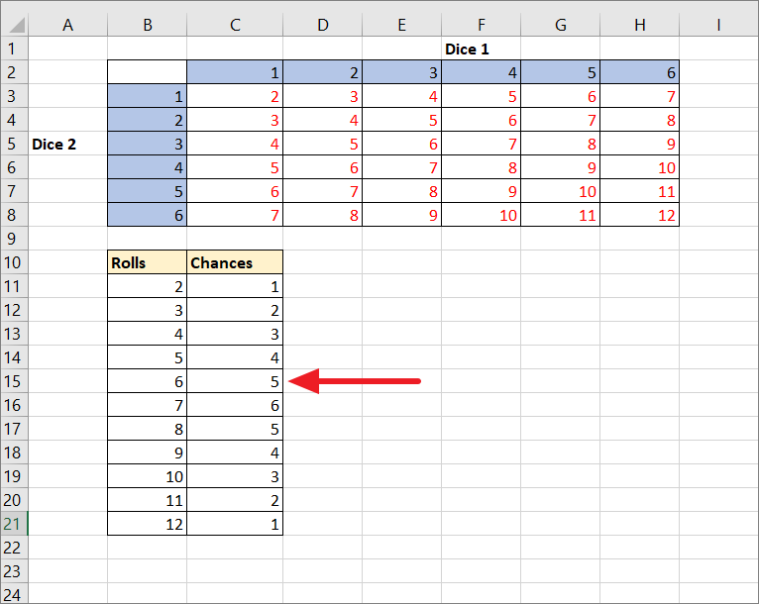
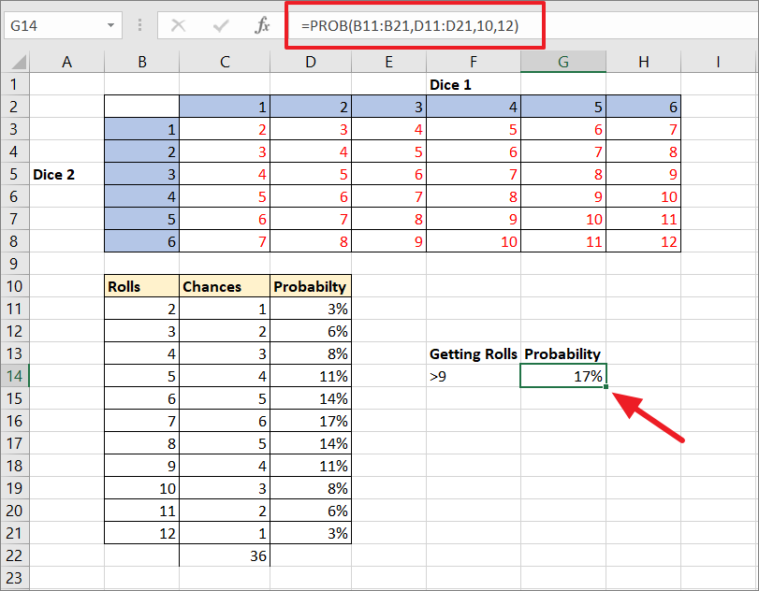
Example 2: Dice Probabilities
Let’s see how to calculate probability with a bit more complex example. Suppose, you got two dice and you want to find the probability of the sum for rolling two dice.
The table below shows the probability of each die landing on a certain value on a specific roll:
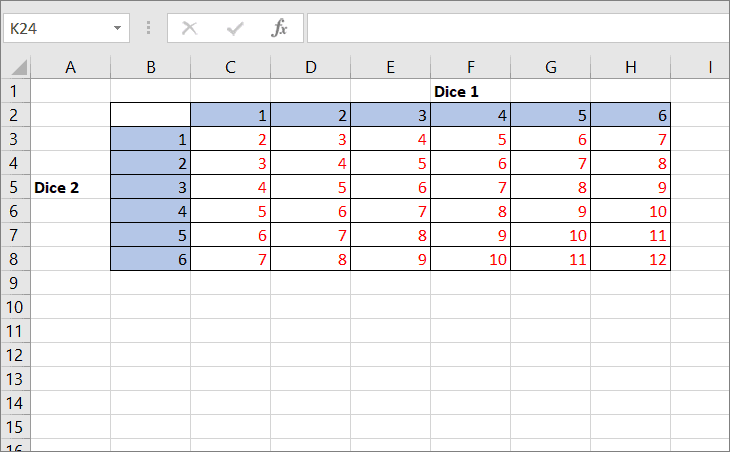
When you roll two dices, you would get the sum of numbers between 2 and 12. The numbers in the red are the sum of two dice numbers. The value in C3 is equal to the sum of C2 and B3, C4=C2+B4, and so on.
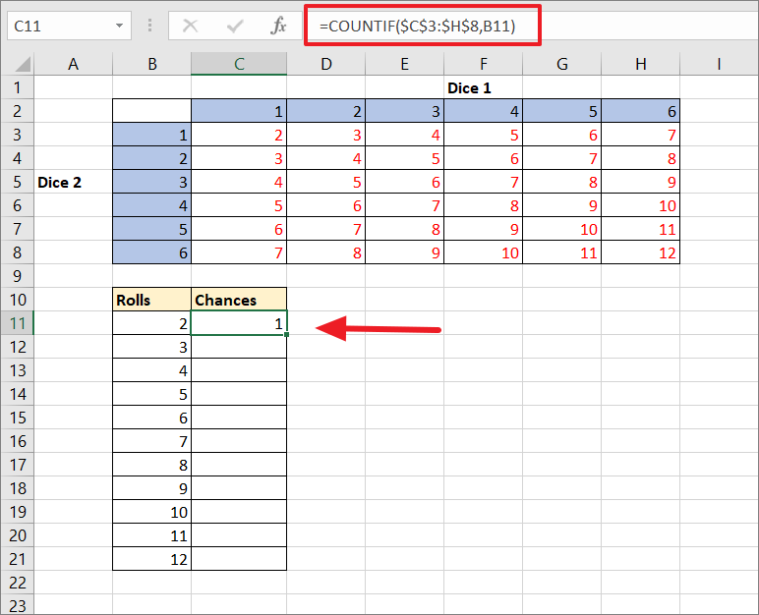
The probability of getting 2 is possible only when we get 1 on both dice (1+1), so chance = 1. Now, we need to calculate the chances to roll using the COUNTIF function.
We need to create another table with the sum of rolls in one column and their chance of getting that number in another column. We need to enter the below roll chance formula in cell C11:
=COUNTIF($C$3:$H$8,B11)The COUNTIF function counts the number of chances for the total roll number. Here, the range is given $C$3:$H$8 and the criteria is B11. The range is made an absolute reference so it doesn’t adjust when we copy the formula.
Then, copy the formula in C11 to other cells by dragging it down to cell C21.
Now, we need to calculate the individual probabilities of the sum of numbers occurring on the rolls. To do that, we need to divide the value of each chance by the total value of chances, which is 36 (6 x 6 = 36 possible rolls). Use the below formula to find individual probabilities:
=B11/36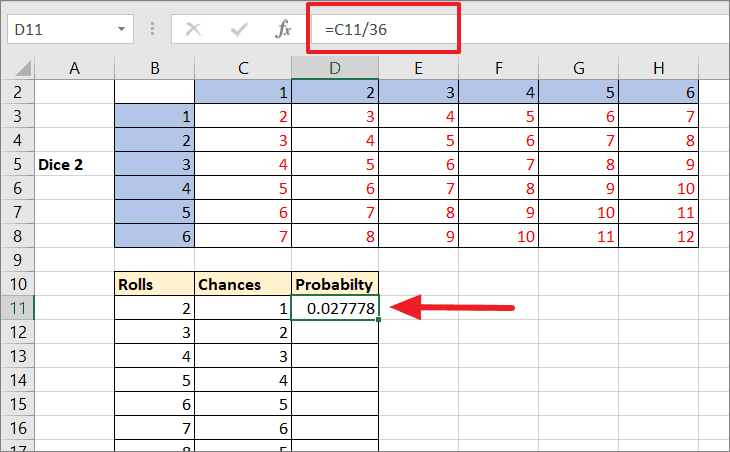
Then, copy the formula to the rest of the cells.
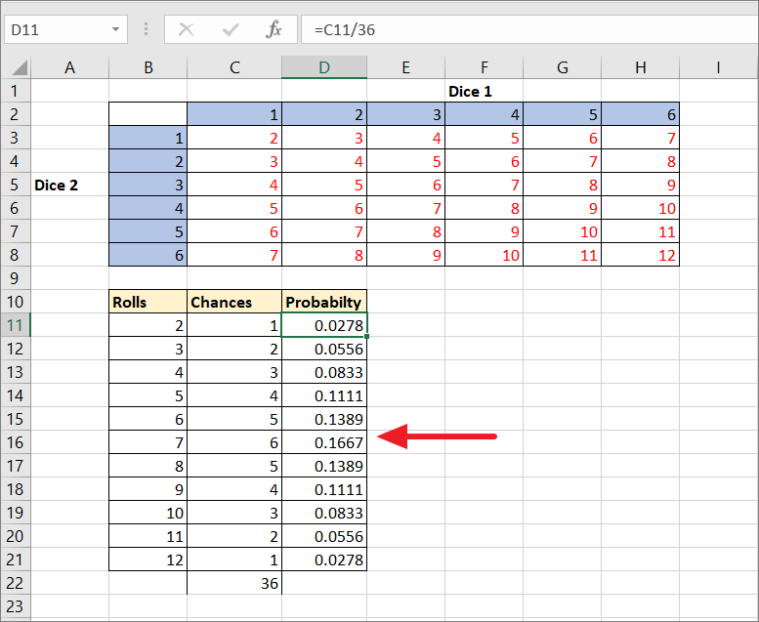
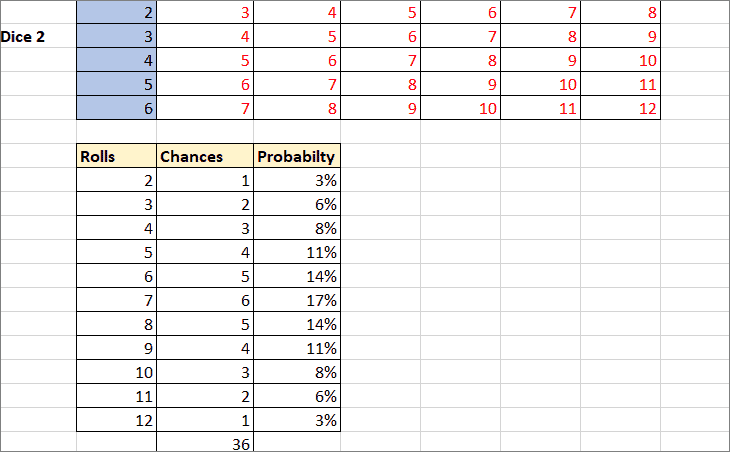
As you can see, 7 has the highest probability on rolls.
Now, let’s say you want to find the probability of getting rolls higher than 9. You can use the below PROB function to do that:
=PROB(B11:B21,D11:D21,10,12)Here, B11:B21 is the event range, D11:D21 is the associated probabilities, 10 is the lower limit and 12 is the upper limit. The function returns ‘0.17’ in cell G14.
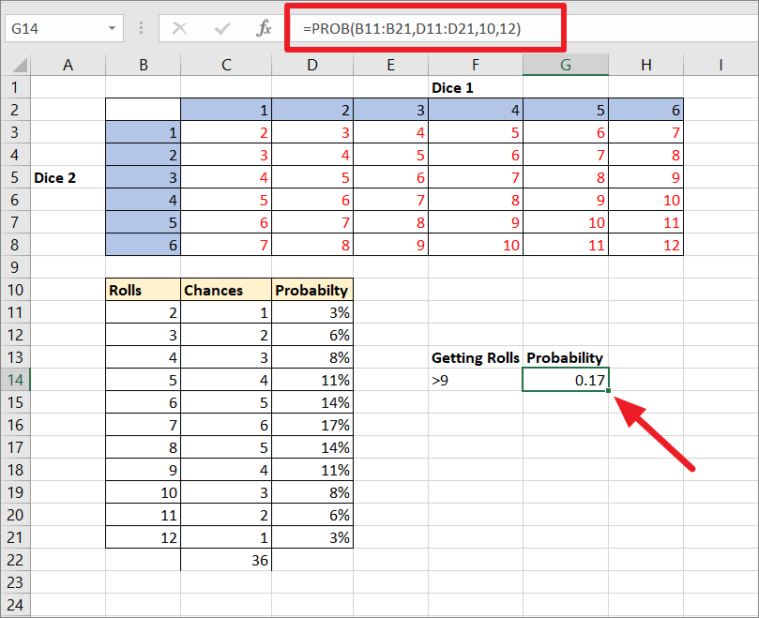
As you can see, we have a ‘0.17’ or ‘17%’ chance of two dices landing on the sum of rolls higher than 9.
Calculating Probability Without the PROB Function in Excel (Example 3)
You can also calculate probability without the PROB function using only a simple arithmetic calculation.
Generally, you can find the probability of occurrence of an event using this formula:
P(E) = n(E)/n(S)Where,
- n(E) = the number of occurrences of an event.
- n(S) = Total number of possible outcomes.
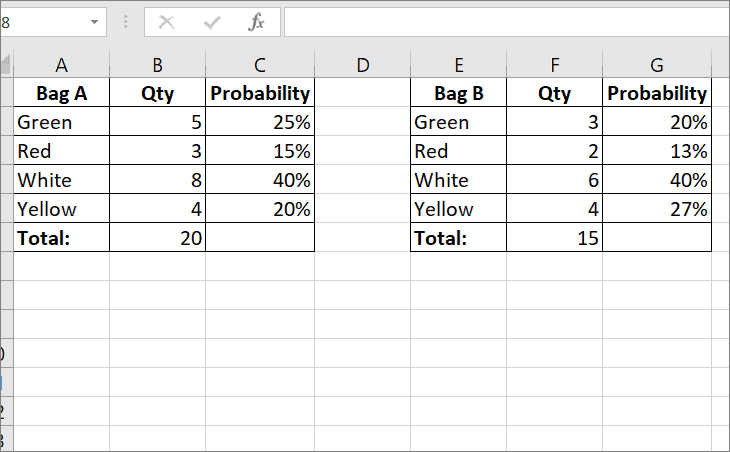
For example, suppose you have two bags full of balls: ‘Bag A’ and ‘Bag B’. Bag A has 5 green balls, 3 white balls, 8 red balls, and 4 yellow balls. Bag B has 3 green balls, 2 white balls, 6 red balls, and 4 yellow balls.
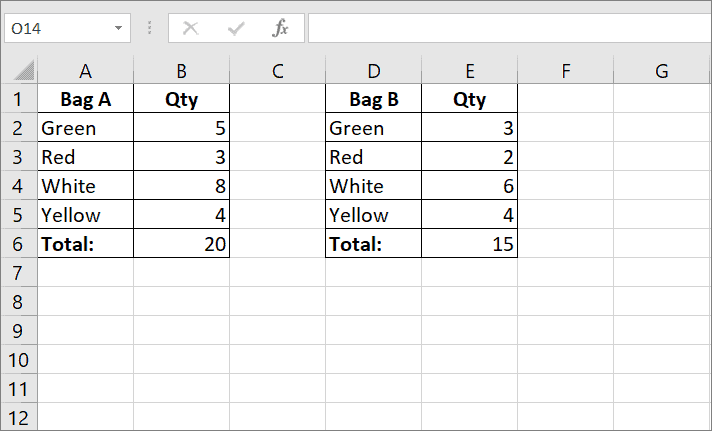
Now, what is the probability of two people picking 1 green ball from bag A and 1 red ball from bag B simultaneously? Here’s how you calculate it:
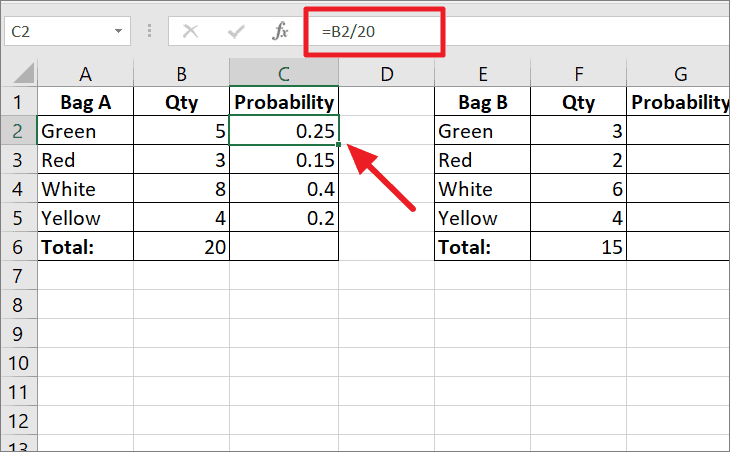
To find the probability of picking up a green ball from ‘bag A’, use this formula:
=B2/20Where B2 is the number of red balls (5) divided by the total number of balls (20). Then, copy the formula to other cells. Now, you got individual probabilities for picking up each color ball from bag A.
Use the below formula to find the individual probabilities for balls in Bag B:
=F2/15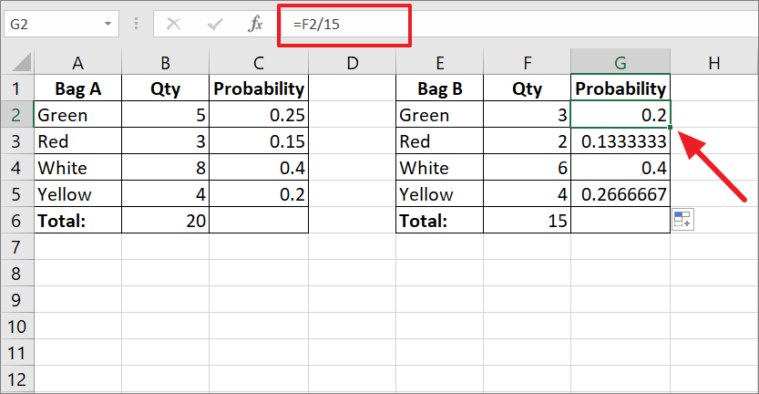
Here, the probability is converted to percentages.
Probability of picking a green ball from bag A and a red ball from bag B together:
=(probability of picking a green ball from bag A) x (probability of picking a red ball from bag B)=C2*G3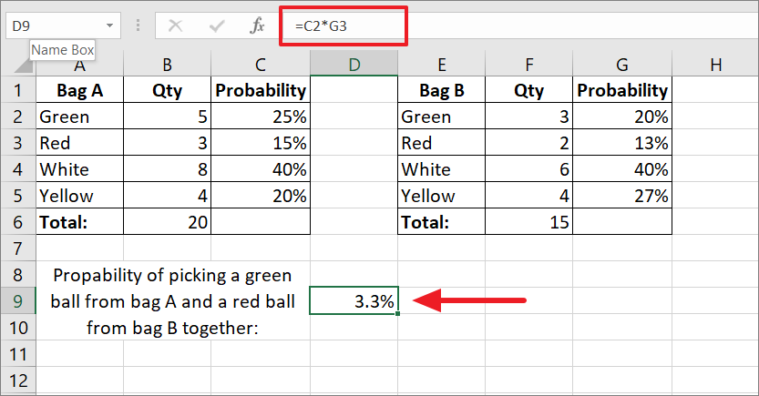
As you can see, the probability of picking a green ball from bag A and a red ball from bag B simultaneously is 3.3%.
That’s it.


