
PowerPoint presentations often fail to hold attention when packed with dense text or raw data. Infographics—visual representations of information—solve this by translating complex concepts into clear, memorable visuals that speed up understanding and retention. PowerPoint offers several methods to insert infographics, from built-in SmartArt graphics to custom templates and external libraries. Here’s how to incorporate infographics into your slides for maximum impact.
Using PowerPoint’s Built-In SmartArt for Infographics
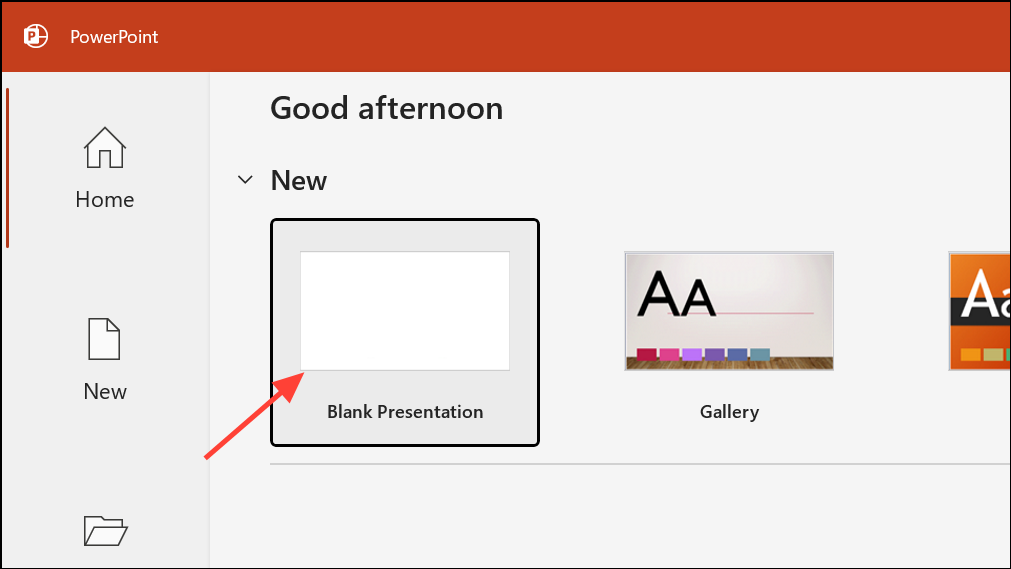
Step 1: Open your PowerPoint presentation and navigate to the slide where you want to add an infographic. If you’re starting fresh, select File > New > Blank Presentation to create a new deck.
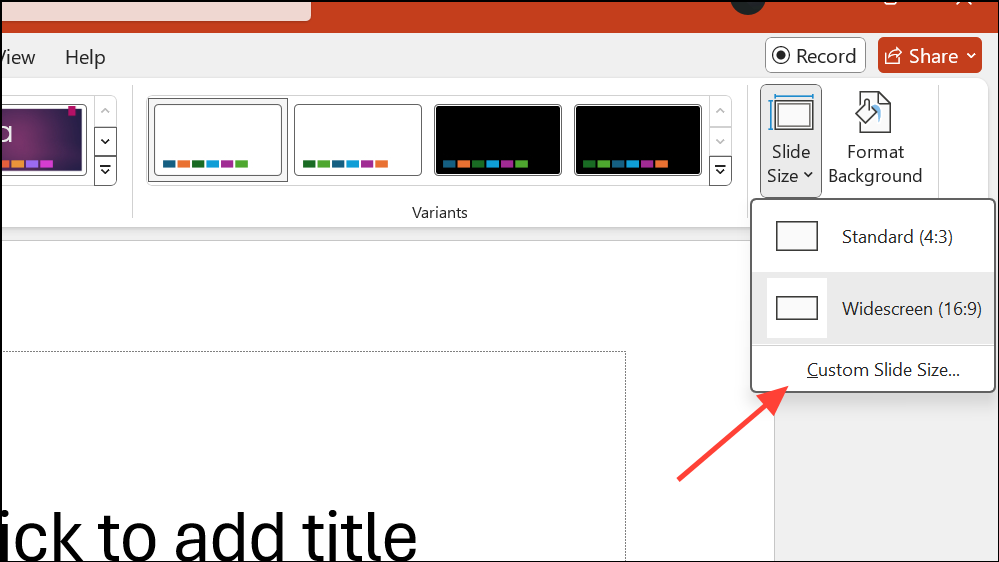
Step 2: Adjust the slide size for your infographic. Go to the Design tab, select Slide Size, and choose Custom Slide Size. Enter your preferred dimensions (for example, tall and thin: 30cm x 70cm) to give your infographic ample space. Click OK and select Ensure Fit to keep elements proportional.
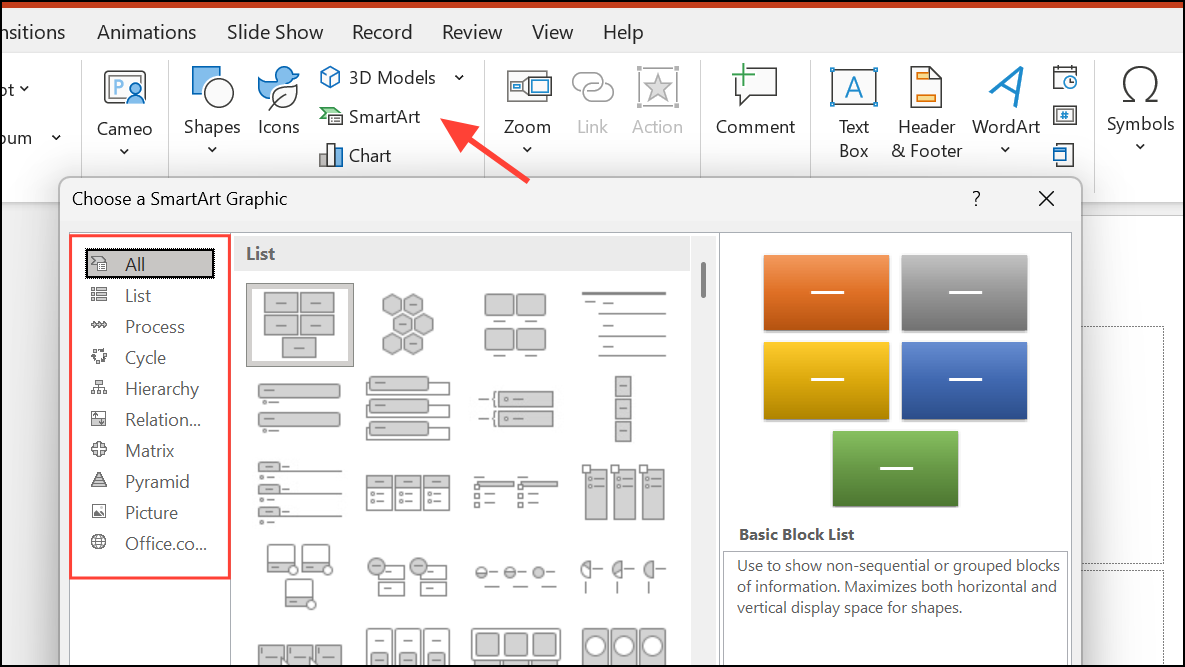
Step 3: Insert a SmartArt graphic. Click the Insert tab, then select SmartArt. Browse through categories such as Process, Hierarchy, Cycle, or Matrix to find a layout that matches your data story. Select your preferred layout and click OK.
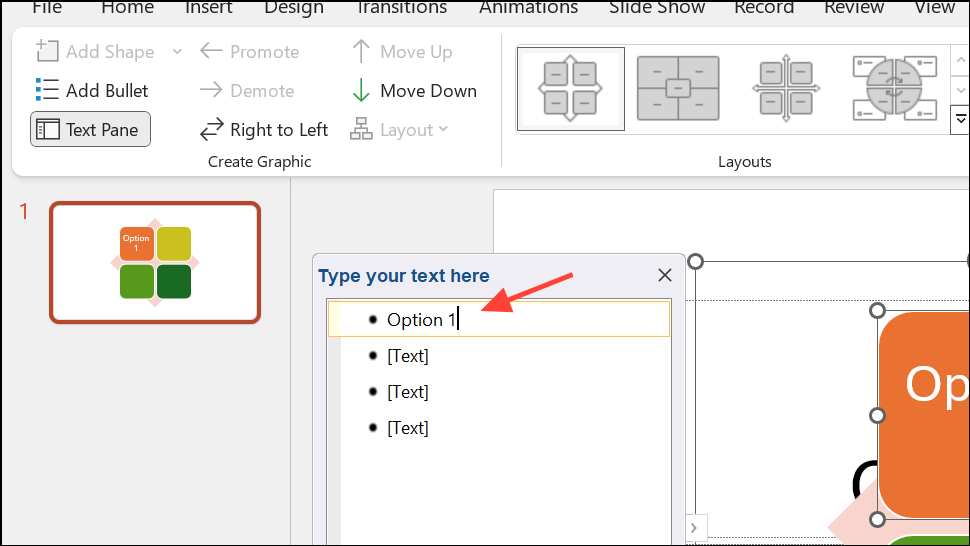
Step 4: Add and edit content in your SmartArt infographic. Click on the placeholder text to enter your information. For processes, add steps; for timelines, add dates and events. You can add or remove elements by right-clicking and selecting Add Shape or Delete as needed.
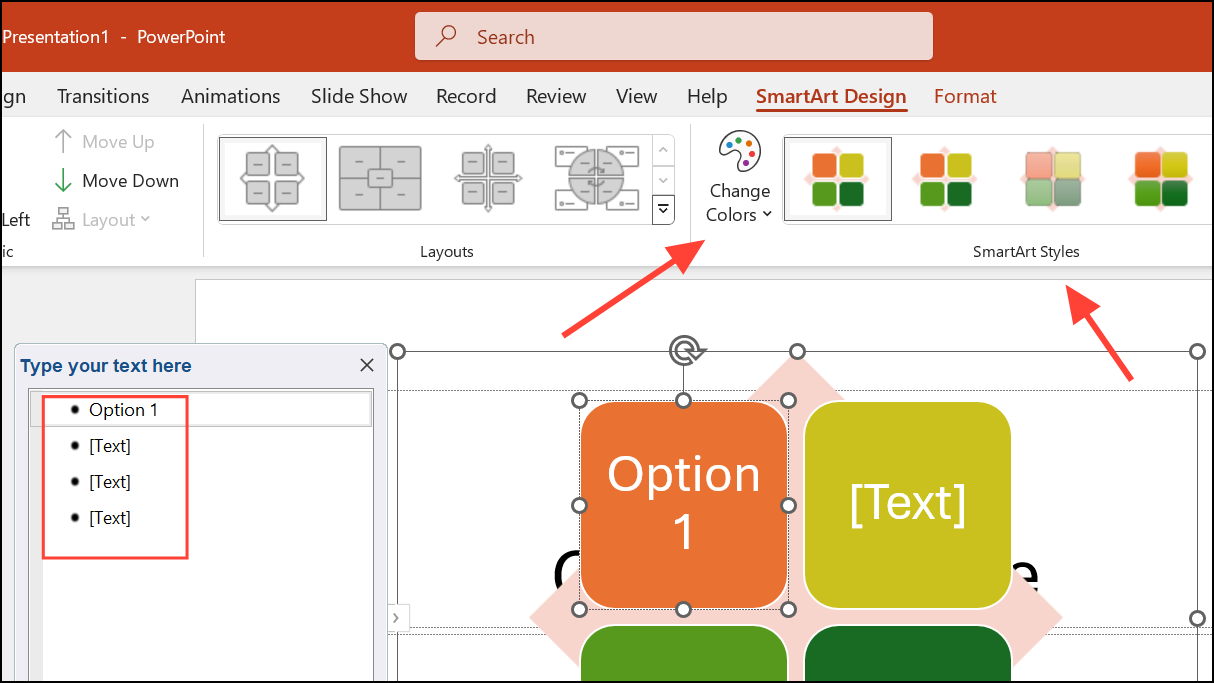
Step 5: Customize the infographic’s appearance. With the SmartArt selected, use the SmartArt Design and Format tabs to change colors, layouts, or styles. To match your branding or story, choose a color scheme under Change Colors, or manually adjust shapes using Shape Fill and Shape Outline.
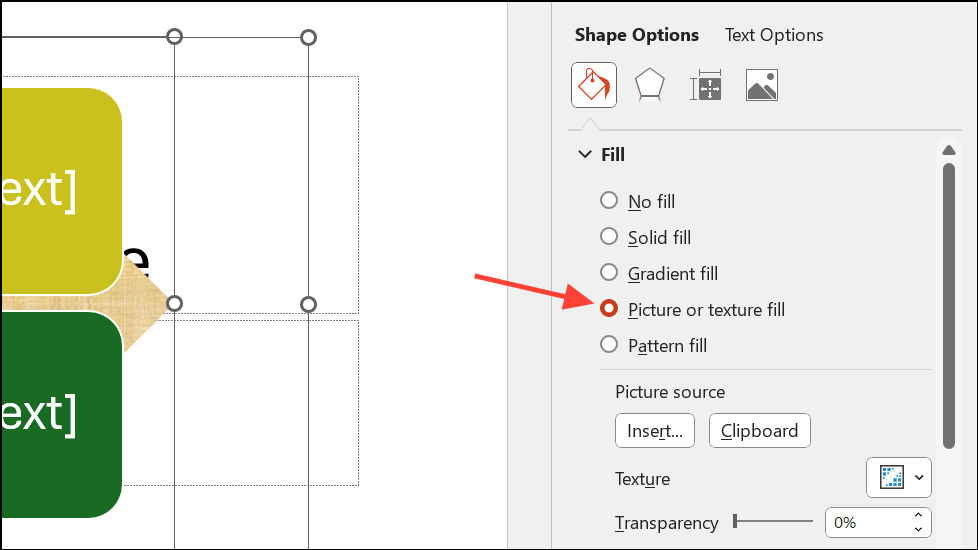
Step 6: Insert images or icons if needed. For SmartArt layouts that support images, right-click the graphic area, select Format Shape, then choose Picture or texture fill to upload visuals. Adjust as necessary to fit the space.
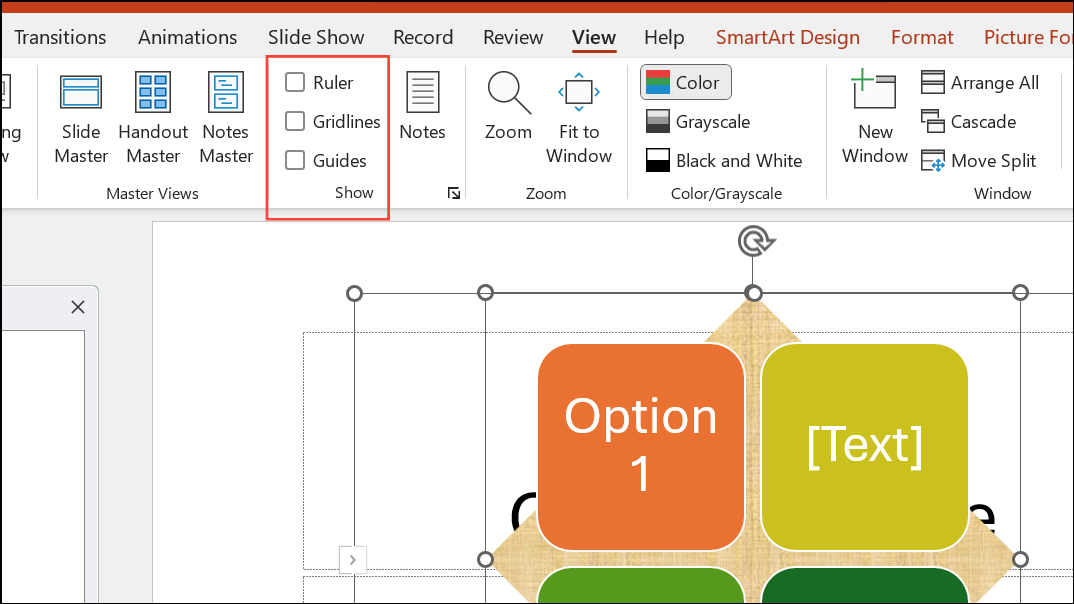
Step 7: Refine the layout for clarity and flow. Use PowerPoint’s alignment guides and gridlines (found under the View tab) to keep elements organized. Add numbering or headings to guide viewers through your infographic.
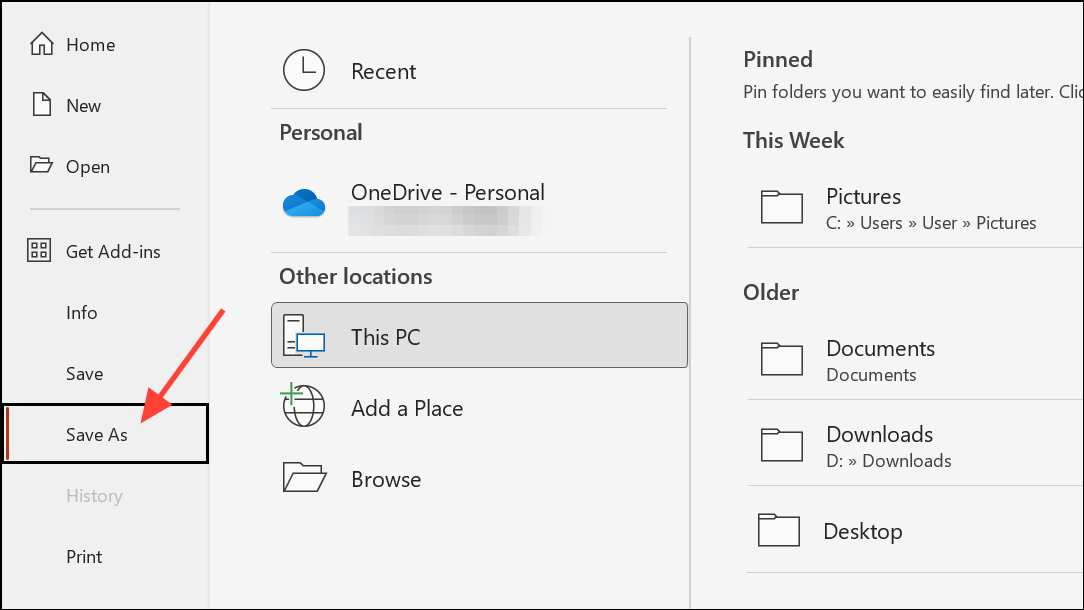
Step 8: Save your work. The infographic is now part of your presentation and can be exported as a PDF or image if needed. To share as a standalone graphic, select File > Save As and choose PNG or PDF from the dropdown menu.
Importing and Customizing Infographic Templates
PowerPoint supports external infographic templates, which can save design time and offer more variety.
Step 1: Download a PowerPoint infographic template from a reputable source. Many sites, including Microsoft Create, HubSpot, and Slidesgo, offer free and paid templates with pre-designed layouts, icons, and color schemes.
Step 2: Open both your main presentation and the template file. Locate the infographic slide or element you want to use.
Step 3: Select the infographic (click and drag to highlight all relevant shapes and text), then copy it using Ctrl + C (or Cmd + C on Mac).
Step 4: Switch to your main presentation and paste the infographic onto your chosen slide with Ctrl + V (or Cmd + V on Mac). The infographic will adopt your presentation’s theme colors by default.
Step 5: To further adjust colors, double-click on individual elements and use Shape Fill or Shape Outline. For icons, right-click and select Group > Ungroup to modify colors or shapes, then Group > Regroup when finished.
Step 6: Edit text, icons, and layout as needed to fit your content. Experiment with different font styles, sizes, and alignments for clarity and visual appeal.
Step 7: Save your updated presentation and export the infographic if you need a standalone image or PDF.
Leveraging PowerPoint’s Icon and Illustration Libraries
Icons and illustrations can quickly clarify ideas and break up text-heavy slides. PowerPoint includes a large library of scalable vector icons and basic illustrations.
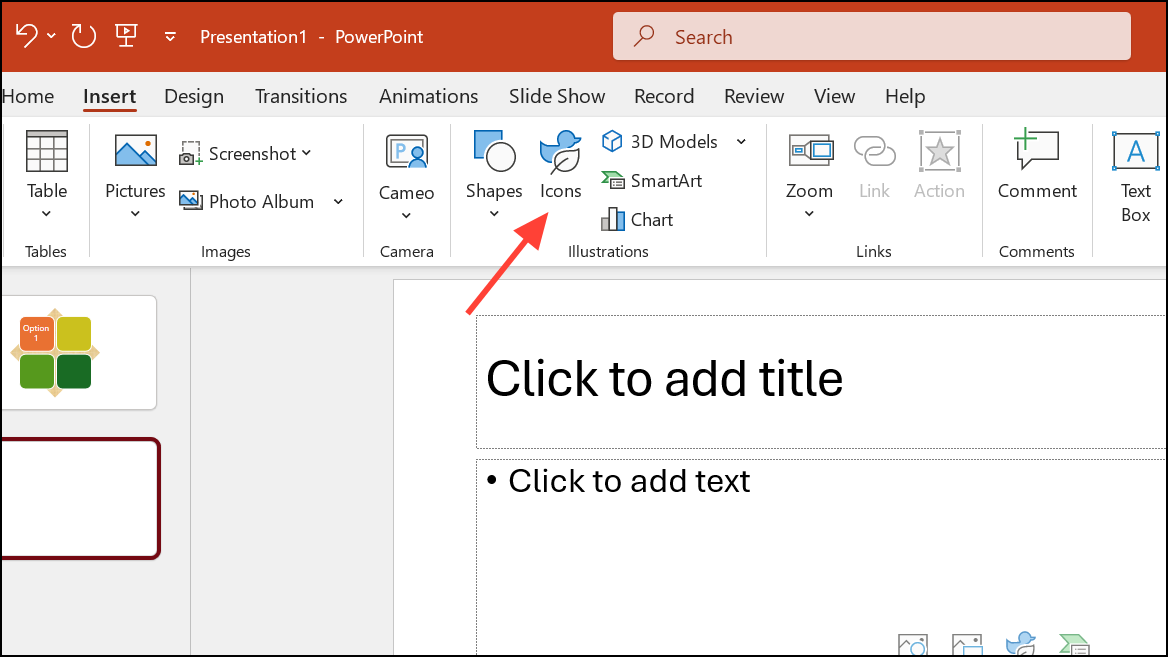
Step 1: Go to the Insert tab and select Icons. Use the search bar or browse categories to find suitable icons. Select one or multiple icons, then click Insert.
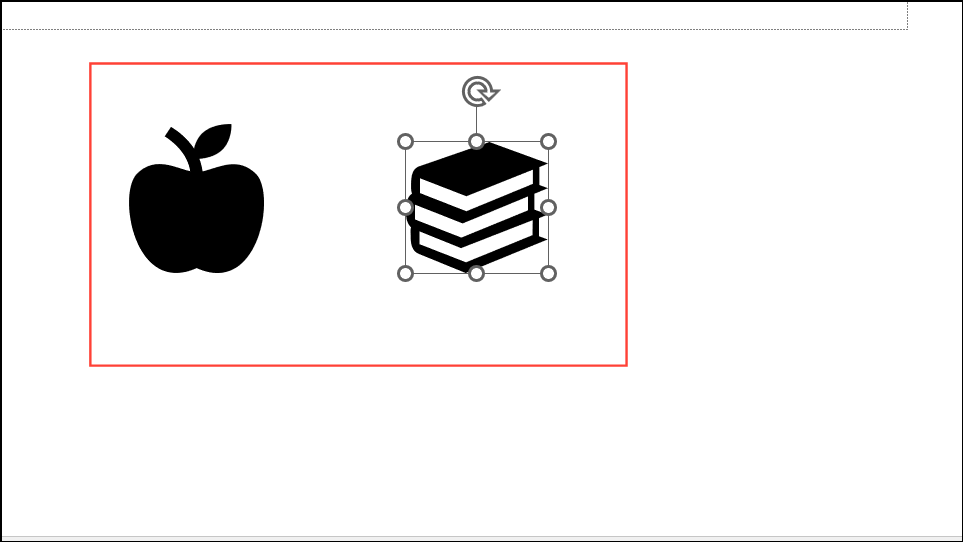
Step 2: Resize and position icons as needed. To keep multiple icons consistent, select them together and resize as a group before arranging individually.
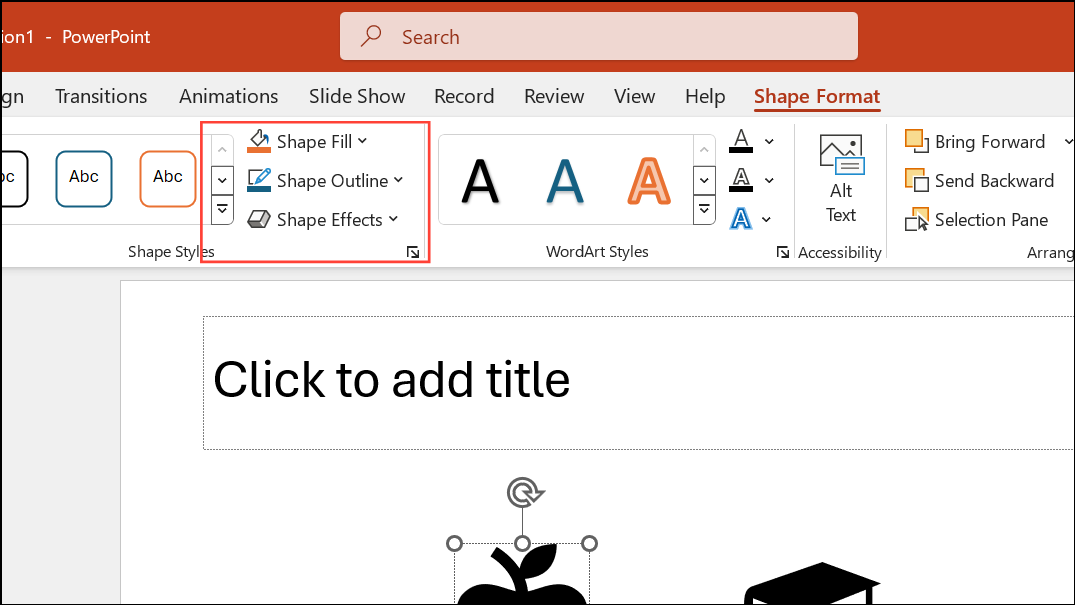
Step 3: Change icon colors using the Shape Format tab and Shape Fill. For more customization, use Convert to Shape to break an icon into editable parts, allowing you to recolor or delete specific segments.
Step 4: Combine icons with lines, arrows, or shapes to build custom diagrams and data visuals. Use the Format Shape pane to adjust line thickness, arrowheads, and dash styles for clarity.
Tips for Effective Infographics in PowerPoint
- Limit the number of colors to 3–4 that complement each other or match your brand palette.
- Keep text concise—focus on key messages or data points.
- Use icons, borders, and varied fonts to add visual interest, but avoid clutter.
- Emphasize important numbers or trends with bold colors or shapes.
- Align and space elements using gridlines and guides for a tidy, professional layout.
- Test your infographic for readability—view it at full screen and print size.
For more complex infographics, consider using external design tools like Venngage or Canva, which offer advanced customization and export options for PowerPoint integration.
Adding infographics to PowerPoint makes your message clearer and more memorable, whether you use built-in tools or custom templates. Experiment with layouts, icons, and color schemes to find the best fit for your data and audience.