The GNU Debugger (gdb) is a powerful tool that allows developers to see what is happening inside a program while it runs or what the program was doing when it crashed. This guide will show you how to use gdb to debug a simple C program in a Linux environment.
vim or your preferred text editor to create a new file named test.c.vim test.c#include <stdio.h>
int main() {
int i = 5;
float f = 5.5;
i = i + 3;
f = f + 2.2;
printf("Value of i and f are: %d and %f\n", i, f);
return 0;
}
Ensure that all semicolons are correctly placed to avoid compilation errors. Press Escape to switch to command mode in vim, then type :wq to save the file and exit the editor.
gcc test.c -o test
./test
You should see the following output:
Value of i and f are: 8 and 7.700000
-g flag, which includes debug information in the executable:gcc test.c -g -o testgdb testThis will open the gdb console, where you can enter debugging commands. To see a list of available commands, type:
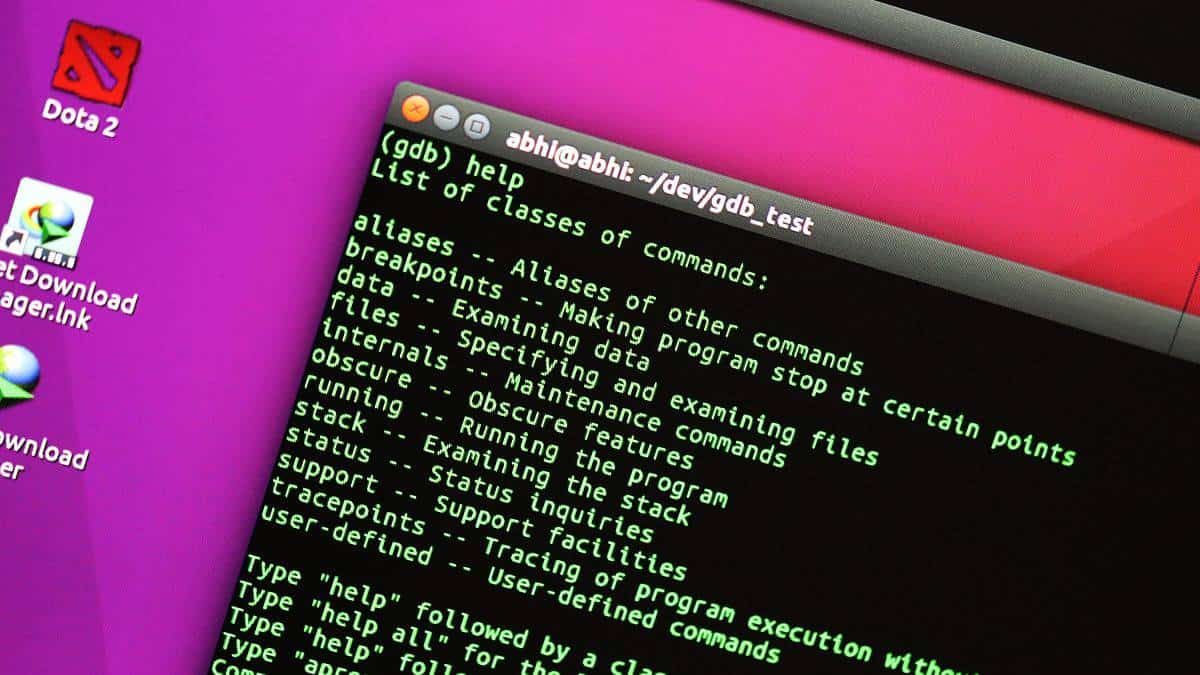
(gdb) help
You can get help on a specific class of commands by typing help <class_name>. Use apropos <keyword> to search for commands related to a specific keyword.
main function so that the program stops there when you run it:(gdb) break mainNow, run the program within gdb to execute it until it reaches the breakpoint:
(gdb) run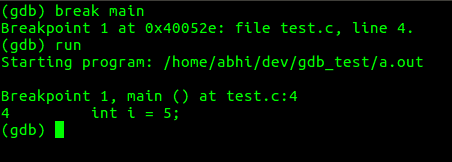
(gdb) break *main + 4This sets a breakpoint at the fourth instruction inside main. To proceed through the program step by step, use the step command:
(gdb) step
For example, stepping through the code might display:
5: float f = 5.5;(gdb) display i
This will show the value of i each time the program stops. If you want to change the value of a variable, use the set variable command:
(gdb) set variable i=10
Now, when you display i, it will reflect the updated value:
(gdb) display i
7: i = 10
(gdb) disassemble main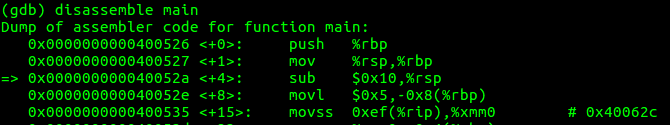
The arrow in the assembly output indicates the current instruction where the debugger is paused.
(gdb) jump *main + 2
This command forces the debugger to jump to the specified instruction. Be cautious when jumping over code that initializes variables, as it may lead to errors when those variables are accessed. For example:
Continuing at 0x400528.

Breakpoint 2, 0x000000000040052a in main () at test.c:3
3	int main() {
1:	i = <error: Cannot access memory at address 0xffffdc48>
2:	f = <error: Cannot access memory at address 0xffffdc4c>
These fundamental gdb commands provide a starting point for debugging programs in Linux. As you become more comfortable with gdb, you can explore its advanced features to perform more complex debugging tasks.