
Presenting complex processes in PowerPoint becomes much clearer when you use flowcharts instead of long blocks of text. Visual diagrams streamline communication, helping your audience quickly grasp sequences, decisions, and relationships within your workflow or system. Microsoft PowerPoint offers two primary ways to create flowcharts: using SmartArt graphics or building diagrams manually with shapes. Both methods offer distinct advantages depending on your needs for speed, customization, and diagram complexity.
Creating a Flowchart with SmartArt
SmartArt provides a quick, streamlined way to insert basic flowcharts into your slides. It’s ideal for straightforward processes where you want to focus on clarity and speed rather than intricate customization.
Insert tab, select SmartArt. This will open the SmartArt Graphic dialog box, displaying various diagram categories.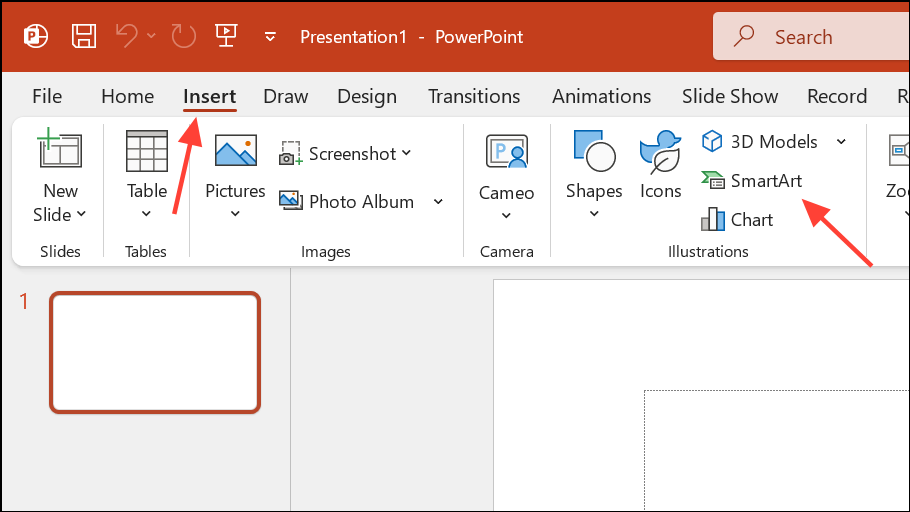
Process category. Browse through the available layouts and single-click any to preview its name and description. Common options include “Basic Process” or “Picture Accent Process” if you want to include images. Click OK after selecting your preferred layout.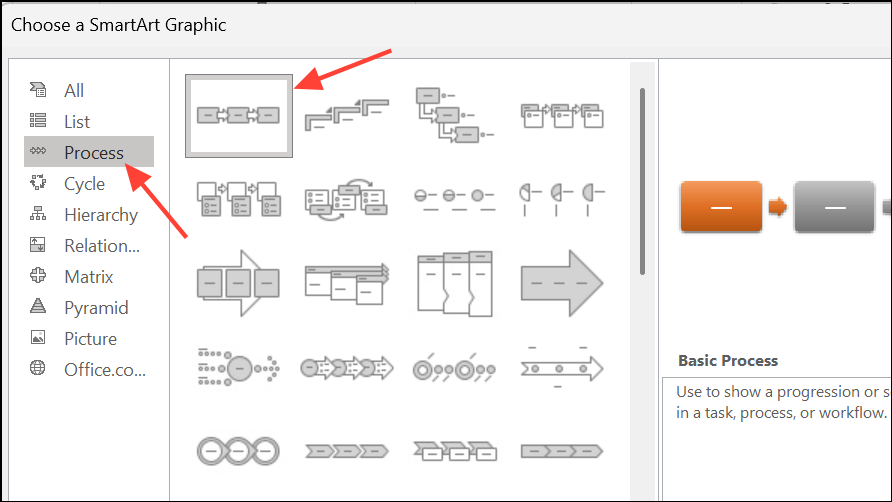
[Text] placeholders with the steps or elements of your process. You can enter text directly into the shapes or use the text pane (toggle it from the SmartArt Design tab if it’s not visible) for easier editing and organization.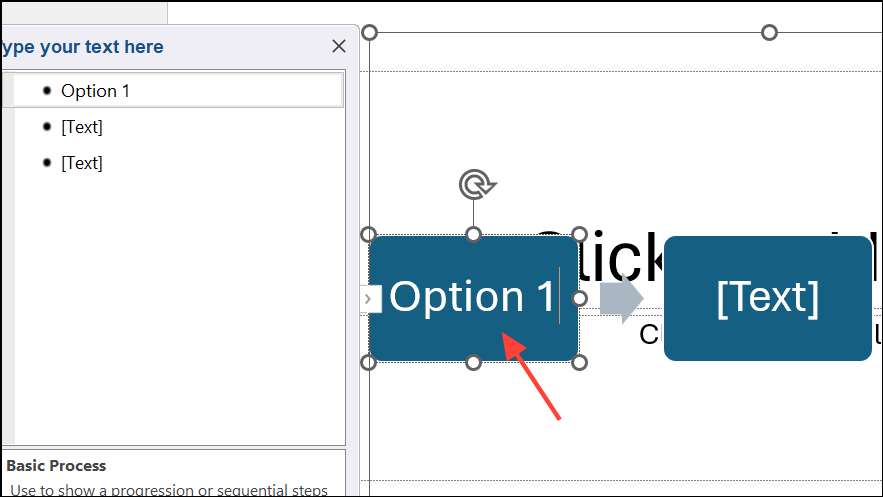
Add Shape button in the SmartArt Design tab. You can insert shapes before or after a selected step, or remove steps by selecting a shape and pressing Delete on your keyboard.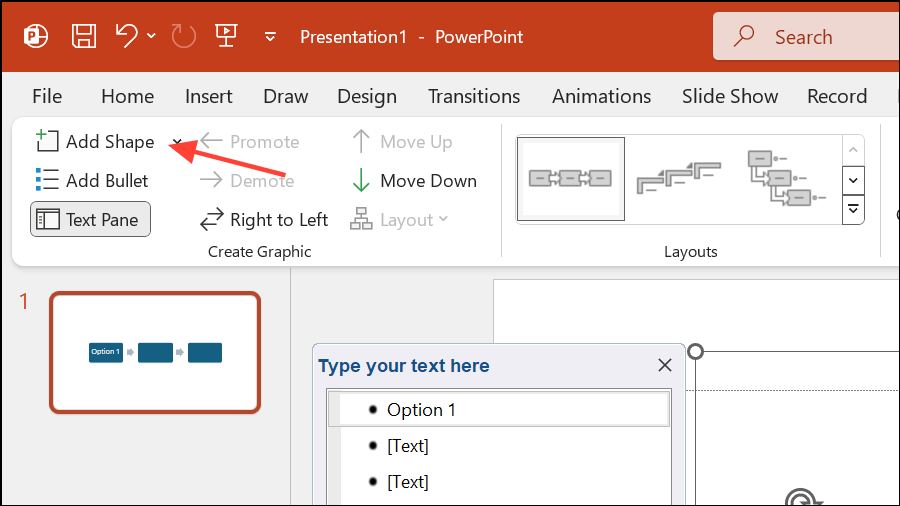
SmartArt Design and Format tabs to adjust color schemes, apply 3D effects, or modify individual shapes. Right-click any shape and select Format Shape to fine-tune fill, border, and transparency settings.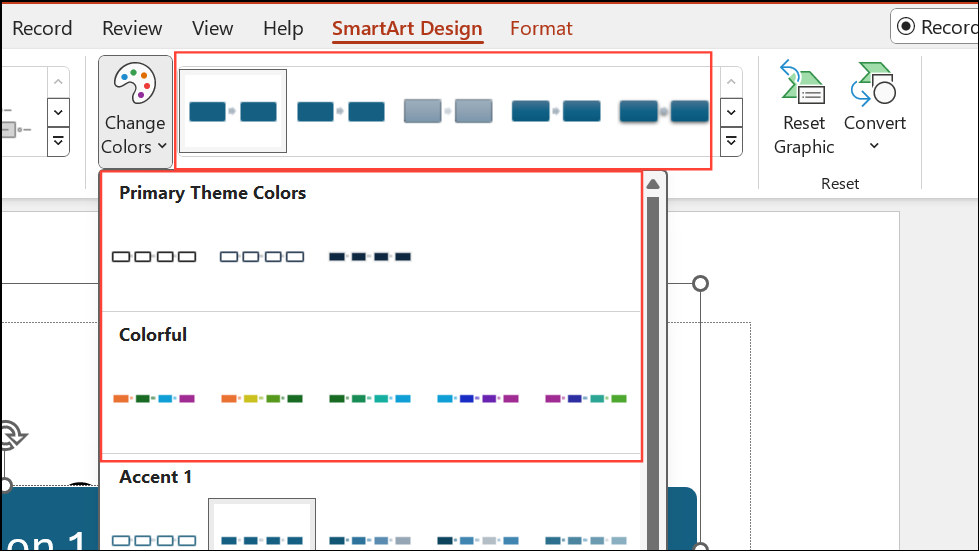
Animations tab, and choose an animation effect. Use Effect Options to set the animation to play “One by one” for each shape.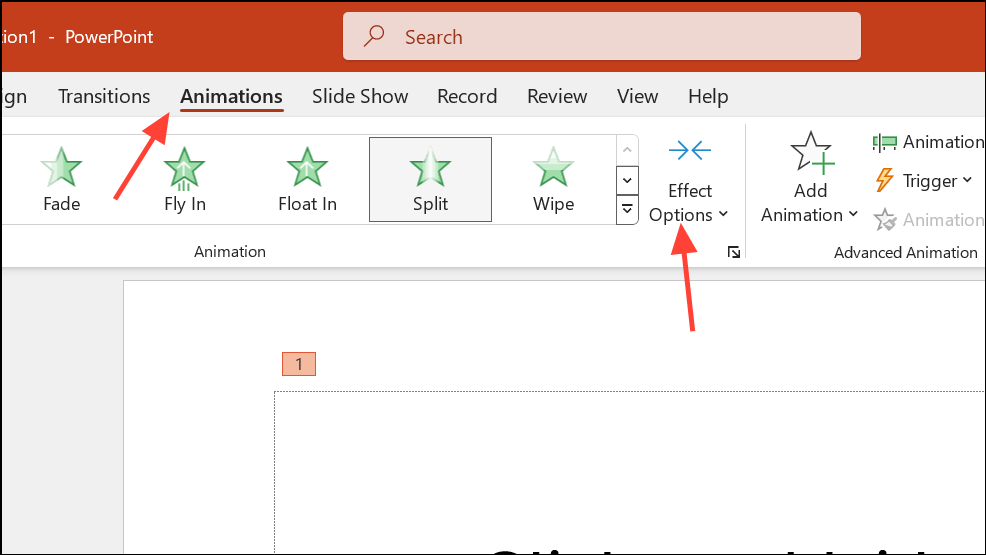
Building a Flowchart Manually Using Shapes
For more complex or traditional flowcharts—such as those requiring unique flowchart symbols, custom connectors, or flexible layouts—manually building your diagram with shapes gives you full control over every element.
Insert tab and select Shapes. Scroll to the “Flowchart” section to access standard symbols like process boxes, decision diamonds, data inputs, and more. Hover over each to see its function.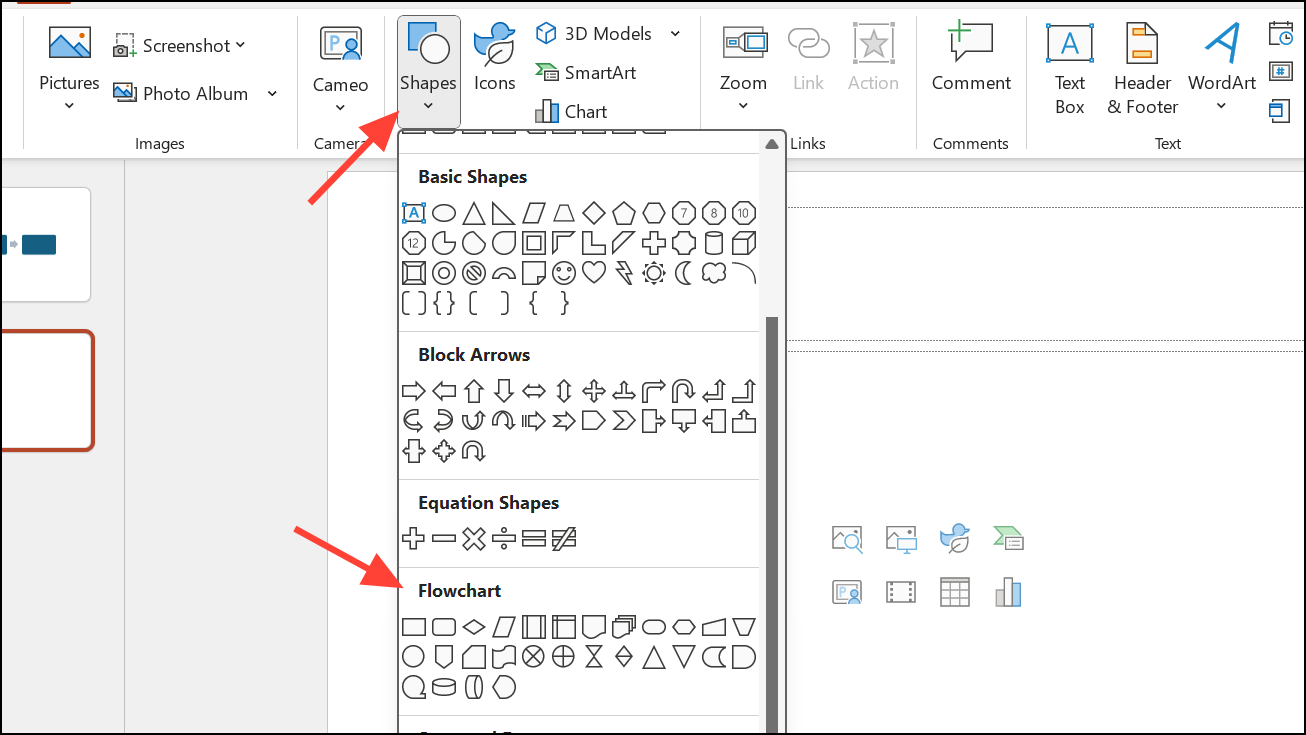
Ctrl+C and Ctrl+V, or quickly duplicate with Ctrl+D.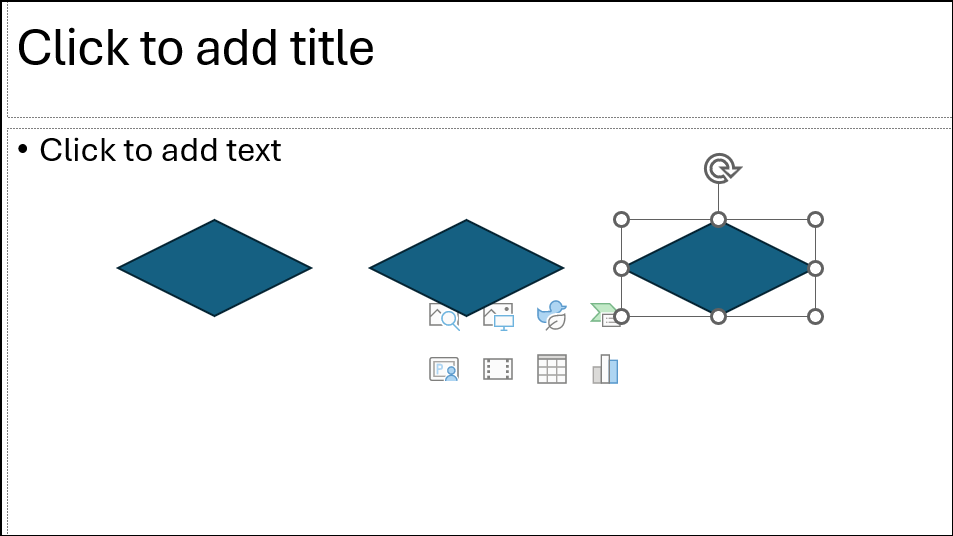
Insert > Shapes and select an arrow or connector from the “Lines” section. Draw lines between shapes by clicking and dragging from one shape’s edge to another. Use anchor points for precise alignment.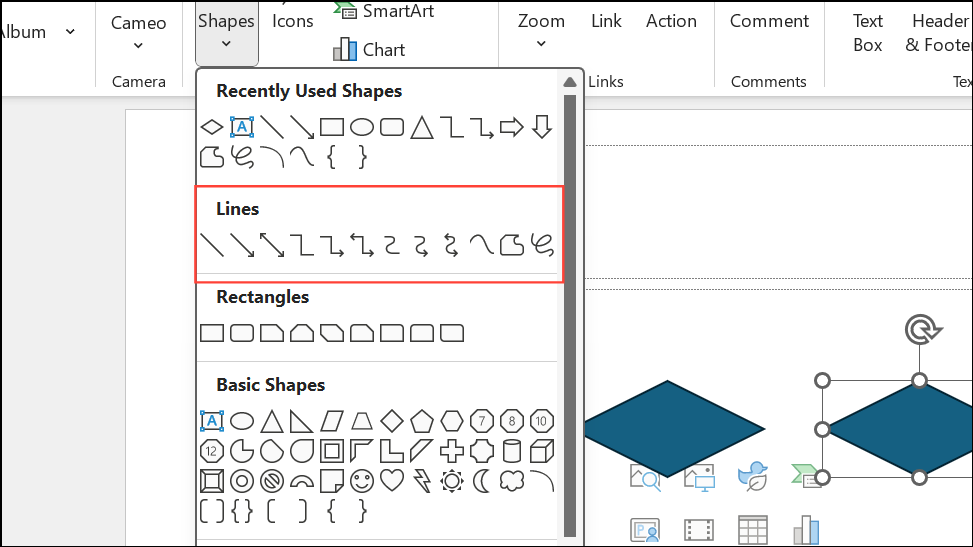
Text Box tool from the Insert tab. Draw the text box near the line and enter your label.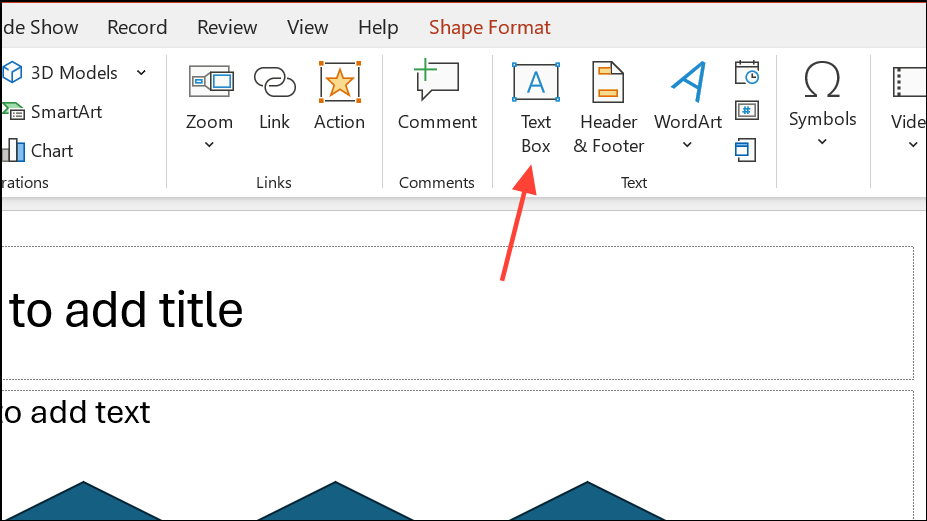
Shape Formattab. Adjust fill color, outline, shadow, or other visual properties to match your presentation’s style or to emphasize key steps.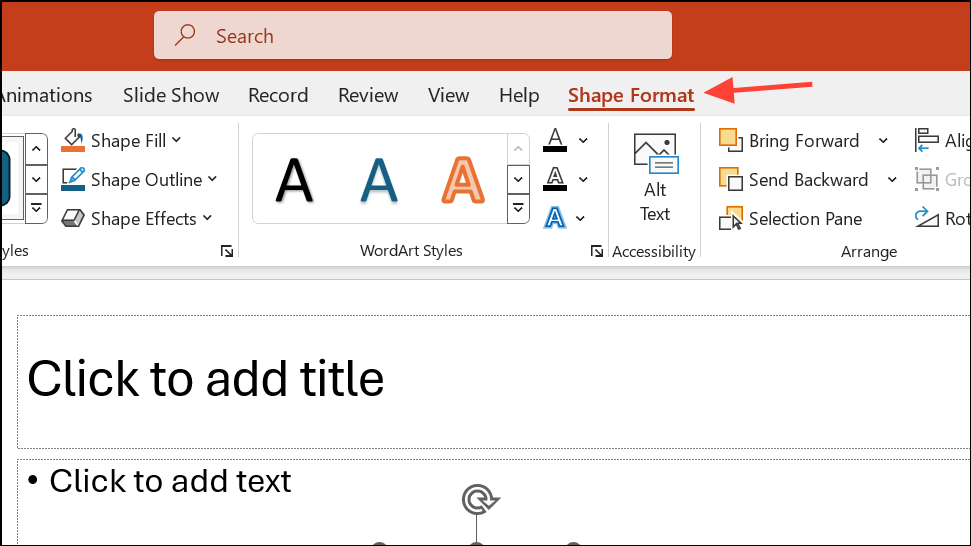
Group. This keeps your diagram organized and prevents accidental misalignment.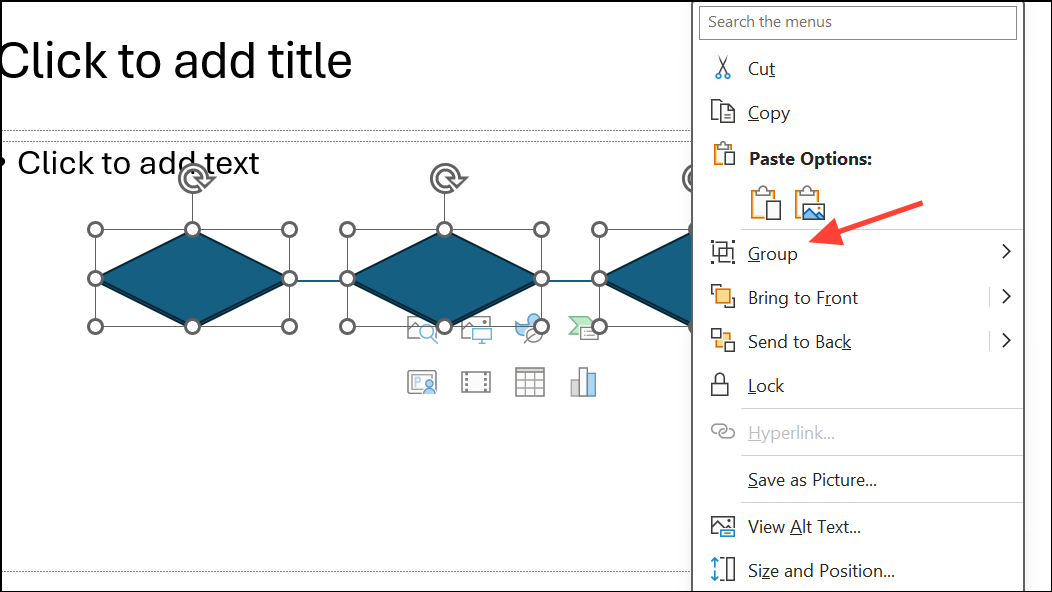
Exporting and Sharing Your Flowchart
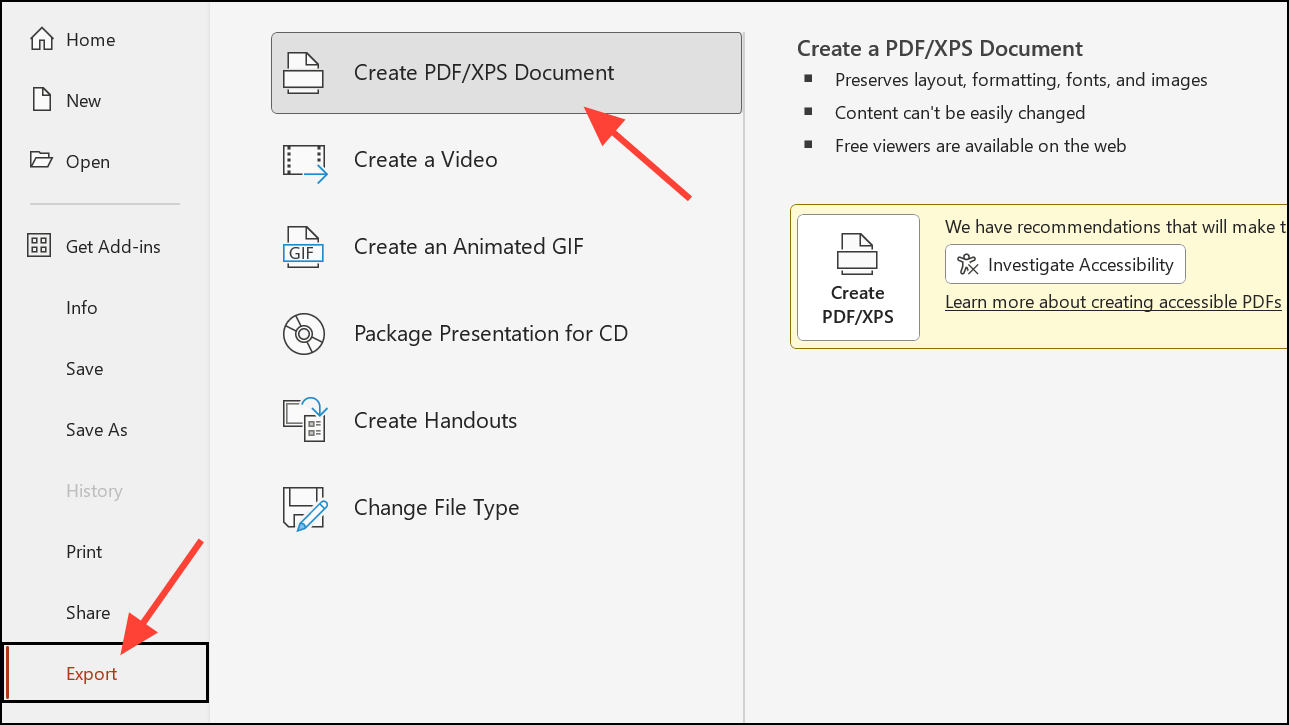
After building your flowchart, you can export your slide or the entire presentation as a PDF for easy sharing. Select File > Export > Create PDF/XPS Document to generate a high-quality, portable version of your diagram. You can also copy and paste your flowchart into other applications, or save your slide as an image by right-clicking the slide in the thumbnail pane and choosing Save as Picture.
Tips for Effective Flowcharts in PowerPoint
- Plan your flowchart before starting, especially for complex processes. Sketching on paper or outlining steps in advance prevents confusion later.
- Use consistent shapes and connectors to maintain clarity and visual order.
- Keep text concise within shapes for easy reading during presentations.
- Leverage color and formatting to highlight important steps or decision points.
- Test your flowchart’s readability by viewing it in presentation mode and adjusting sizes or spacing as needed.
Whether you use SmartArt for speed or shapes for flexibility, PowerPoint provides reliable tools for building process diagrams that clarify your message and improve audience understanding.