The bars in the Wi-Fi taskbar icon only hint at how strong your connection is. They give a rough, abstract reading and never a real number you can compare from room to room. To find the best spot for a laptop, a router, or an access point, you need an exact value in either a percentage or in dBm, and Windows 11 can show that without any extra software.
Quick answer: Open Command Prompt or PowerShell, run netsh wlan show interfaces, and read the Signal line. It reports the strength as a percentage. Convert it to dBm with dBm = (quality / 2) - 100, so a 98% reading equals about -51 dBm.
What an exact signal reading means (dBm and RSSI)
Advanced tools measure Wi-Fi strength in dBm or milliwatts rather than bars. dBm is a negative scale that runs from about -30 to -90. A value near -30 is the strongest you can realistically get, while -90 is close to unusable. For streaming or other bandwidth-heavy work, aim for around -65 dBm or better.
| dBm value | Signal quality |
|---|---|
| -30 dBm | Maximum strength, very close to the router |
| -65 dBm | Reliable for streaming and heavy use |
| -90 dBm | Extremely weak, drops and disconnects likely |
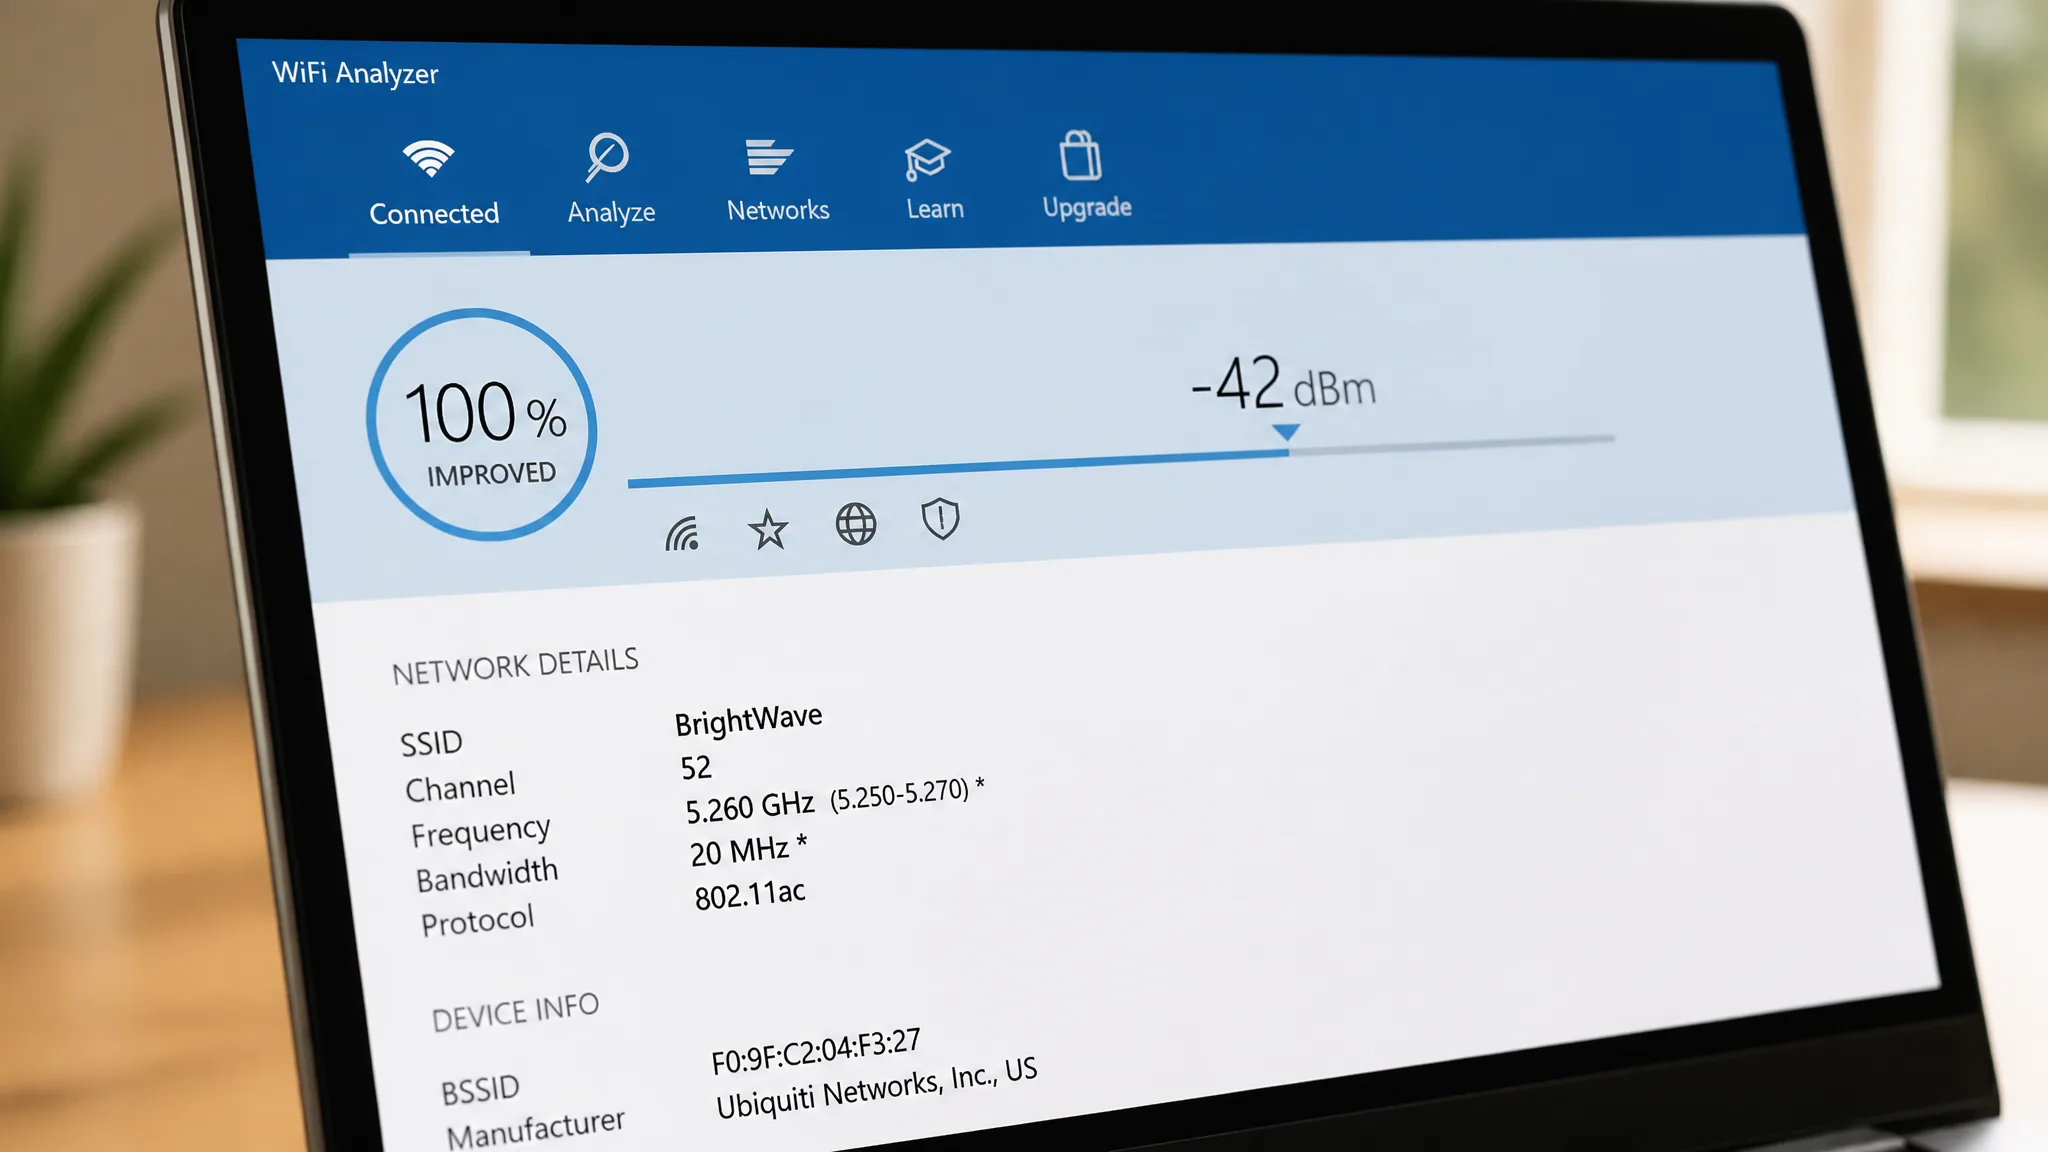
Some apps report RSSI (Received Signal Strength Indicator) instead of dBm. RSSI is not a standardized unit, so the conversion depends on the tool. For NirSoft’s reading, the formula is RSSI - 95 = signal strength in dBm. An RSSI of -42 works out to roughly -53 dBm.
Get the exact percentage with the netsh command
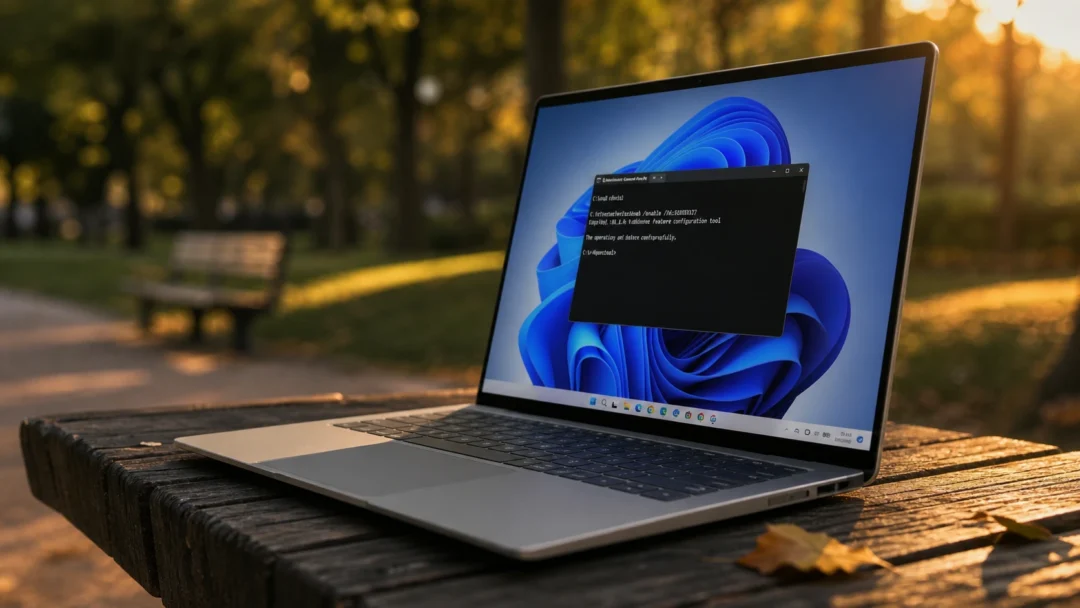
The fastest way to read a precise value needs no installation at all. Windows includes a network shell command that prints the signal as a percentage, which you can then convert to dBm. Make sure you are connected to the Wi-Fi network you want to test before you run it.
cmd from the Start menu, or right-click Start and pick Terminal.netsh wlan show interfacesSignal value, shown as a percentage. The higher the number, the stronger the connection. You can rerun the command as many times as you like, and the value will shift slightly each time you move the device or the router.If you only want the percentage on its own, this one-liner strips out everything else. It runs the same in Command Prompt or PowerShell.
(netsh wlan show interfaces) -Match '^\s+Signal' -Replace '^\s+Signal\s+:\s+',''To turn that percentage into dBm, use dBm = (quality / 2) - 100. A reading of 98% becomes 98/2 – 100, which equals -51 dBm. That lines up closely with what dedicated meters report for the same spot.
Free apps that show exact Wi-Fi signal strength
If you want a graphical readout, live scanning, or a comparison of nearby networks, a dedicated tool gives more than the built-in command. Each one below reports a real value rather than bars, and several can scan neighboring routers too.
| Tool | What it does | Unit / notes |
|---|---|---|
| Fing | Live Wi-Fi scan with a full report for every nearby device | Free on mobile; limited to five scans a day on desktop |
| Wi-Fi Analyzer | Detects networks, sorts by strength, plots channels on a graph | Free from the Microsoft Store; no scan limit |
| NirSoft WifiInfoView | Wraps the netsh command and scans neighboring routers | Reports RSSI; convert with RSSI – 95 = dBm |
| Vistumbler | Scans access points and can add GPS to map coverage | Free; aimed at more technical use |
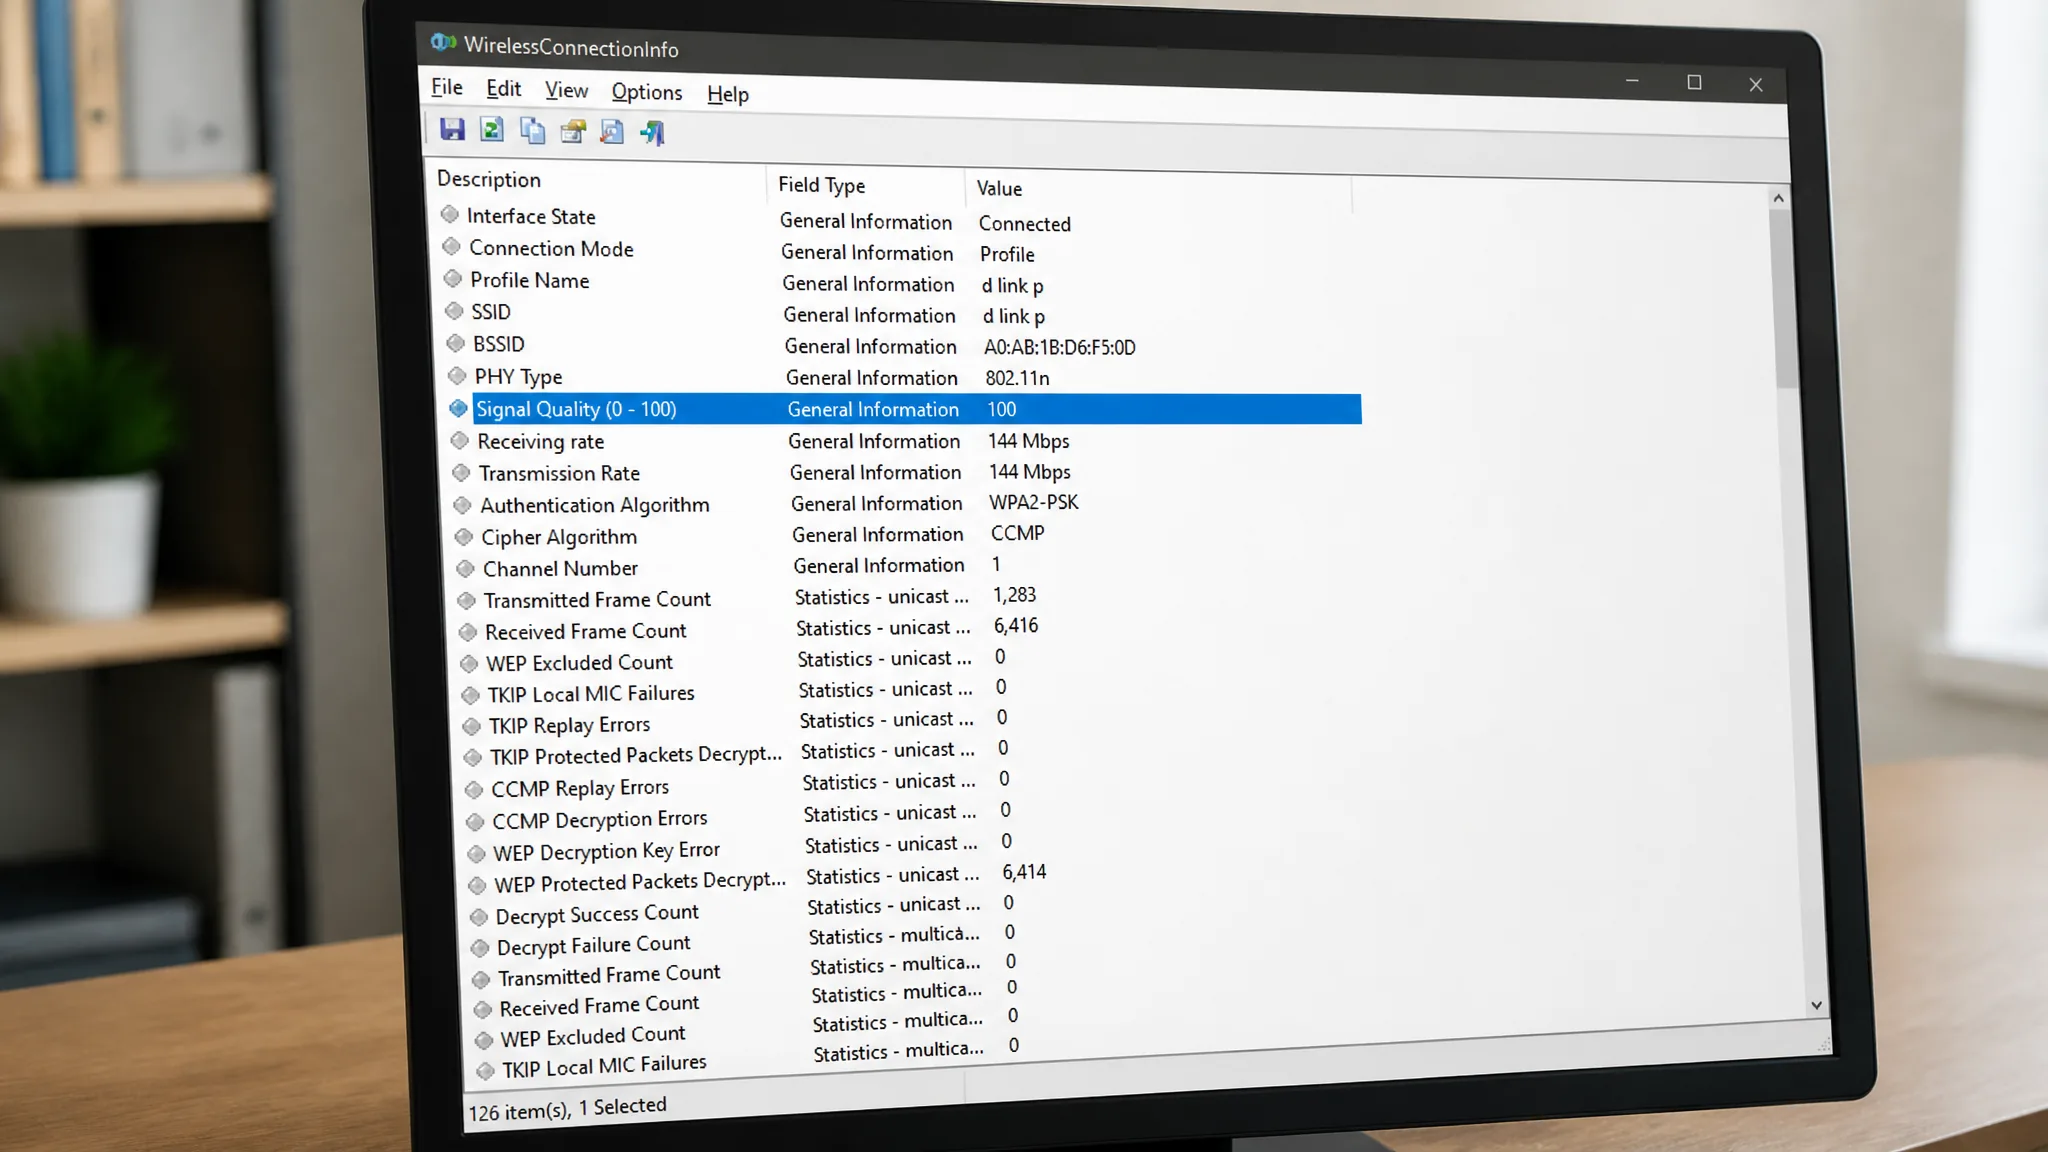
| WirelessConnectionInfo | GUI view of your connection with exportable HTML report | Refresh stats with F5; shows signal strength directly |
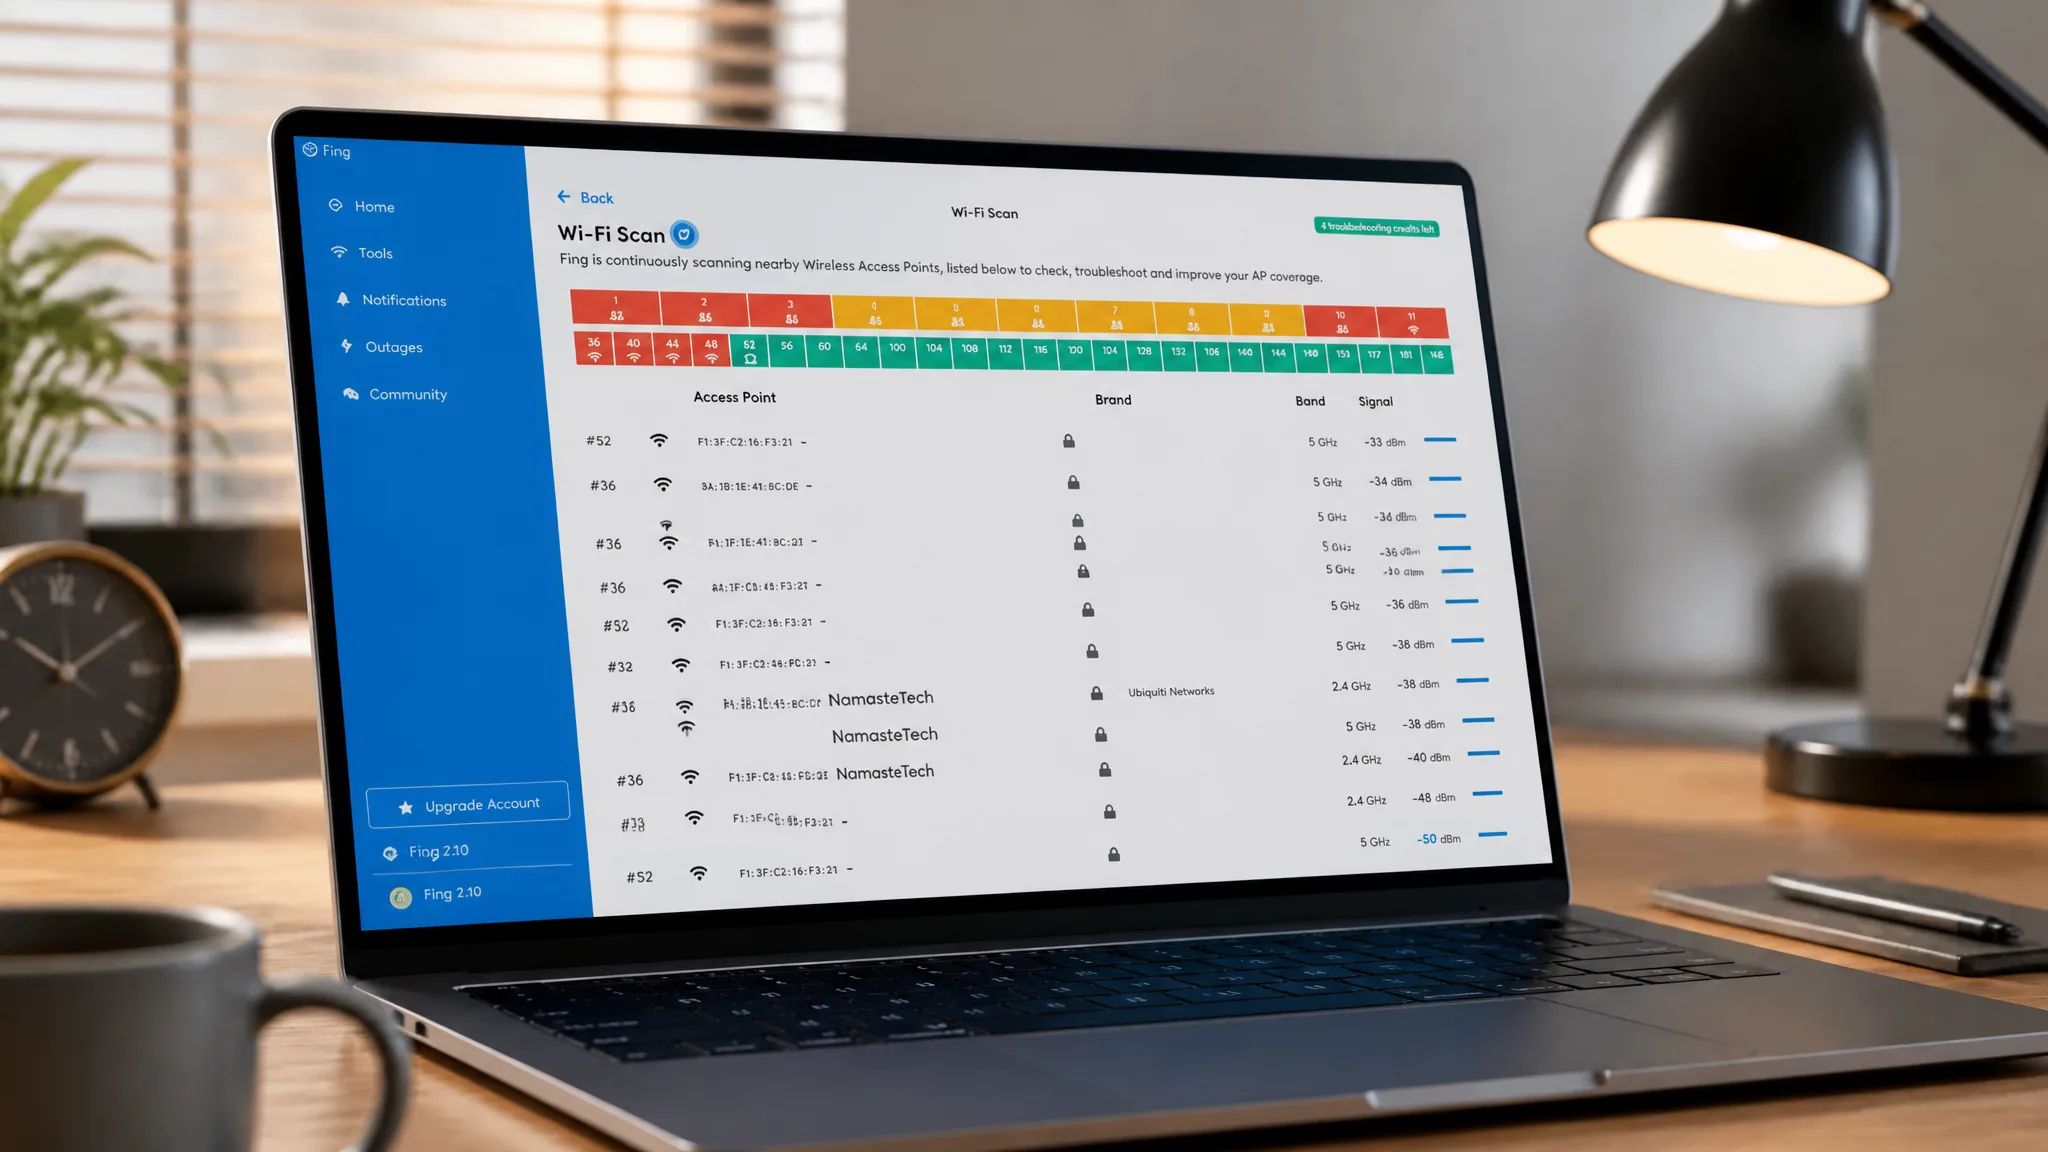
Fing is the most complete option when you want a troubleshooting report. After install, open the tools section and start a Wi-Fi scan to see the strength of every Wi-Fi device around you. The desktop version caps you at five scans a day, but because it tracks the signal live, that is usually enough.
Wi-Fi Analyzer is the simplest. Launch it, grant permission, and it shows results immediately without any further clicks. It helps you find the least crowded channel and the best place for a router or access point, and there is no limit on how often you can check.
WifiInfoView reads the same data the netsh command produces and presents it in plain numbers. It also scans nearby routers, so you can confirm whether the closest one is actually giving you the strongest signal. It uses RSSI rather than dBm, so apply the conversion above to compare values.
WirelessConnectionInfo suits anyone who prefers a window over a terminal. It lists every detail about the network you are connected to, including signal strength, and lets you export the data as an HTML report to share later.
Use the readings to find the best spot
Because each method gives a live value, you can keep the computer in one place and move the router around, or keep the router fixed and walk the laptop through different rooms. Watch how the percentage or dBm changes and settle on the position with the strongest reading. This is the practical way to remove dead zones before buying extra hardware.
If the numbers stay low even with fast internet, the cause is usually distance, thick walls of concrete or brick, or interference. Connecting to a 5 GHz access point gives a stronger, faster link, and if your router cannot do 5 GHz, a newer or mesh model such as the AmpliFi Instant Router can fill in the blind spots with seamless roaming between nodes.
For a quick check, the netsh command is enough on its own. For a full picture of coverage and interference across a home or office, pair it with one of the scanning apps and let the exact dBm numbers guide where everything goes.