
Converting JSON data to an Excel format allows for efficient data analysis and manipulation within Excel's familiar environment. JSON, or JavaScript Object Notation, is a widely used text-based format for storing and transmitting data, especially between a server and web applications. If you have important data in a JSON file that you want to analyze or manage in Excel, you can do so seamlessly using Excel's 'Get & Transform' feature, without the need for any additional code or complex procedures.
Importing JSON Data into Excel
JSON files are structured in a way that is both human-readable and easy for machines to parse. They consist primarily of objects and arrays:
JSON Objects
Objects in JSON are collections of name/value pairs enclosed within curly braces { }. Each pair consists of a field name (in double quotes), followed by a colon, and then the value. For example:
{
    "First Name": "Dulce",
    "Last Name": "Abril",
    "Gender": "Female",
    "Country": "United States",
    "Age": "32",
    "Date": "15/10/2017",
    "Id": "1562"
    }
JSON Arrays
Arrays are ordered lists of values enclosed within square brackets [ ]. They can contain multiple objects or values, separated by commas. An example of a JSON array containing multiple objects would look like this:
[
    {
        "First Name": "Dulce",
        "Last Name": "Abril",
        "Gender": "Female",
        "Country": "United States",
        "Age": "32",
        "Date": "15/10/2017",
        "Id": "1562"
    },
    {
        "First Name": "Mara",
        "Last Name": "Hashimoto",
        "Gender": "Female",
        "Country": "Great Britain",
        "Age": "25",
        "Date": "16/08/2016",
        "Id": "1582"
    }
    ]
This structure allows for complex data sets to be represented in a format that is both lightweight and easy to transmit.
Using Excel's 'Get & Transform' Feature
Excel's 'Get & Transform' tool, formerly known as Power Query, enables you to import and transform data from various sources, including JSON files. This feature is available in Excel 2016, 2019, and Microsoft 365 under the Data tab.
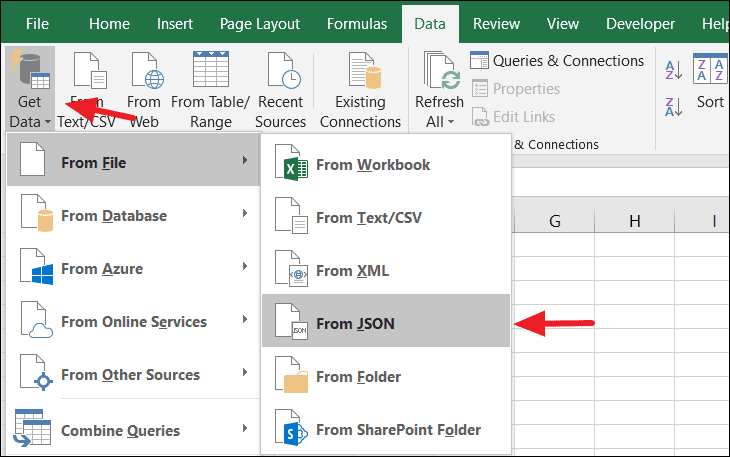
Step 1: Open Microsoft Excel and navigate to the Data tab. In the 'Get & Transform Data' group, click on Get Data. From the drop-down menu, select From File, and then choose From JSON.
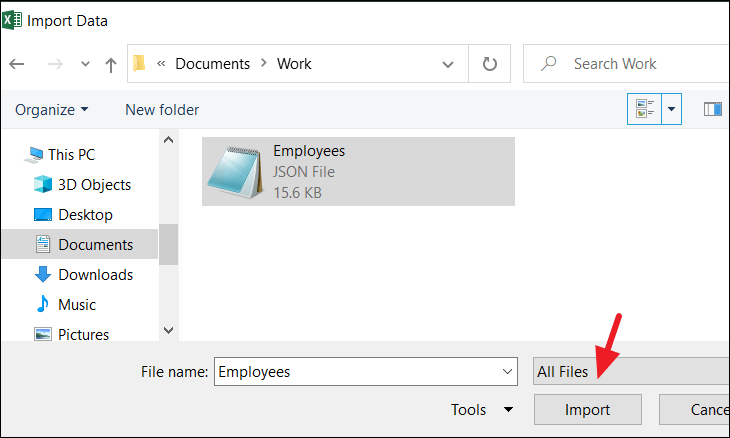
Step 2: In the file browser that appears, locate and select the JSON file you wish to import, then click Import.
If you're importing data directly from a web API, you can select From Web under the Get Data options and enter the API URL.
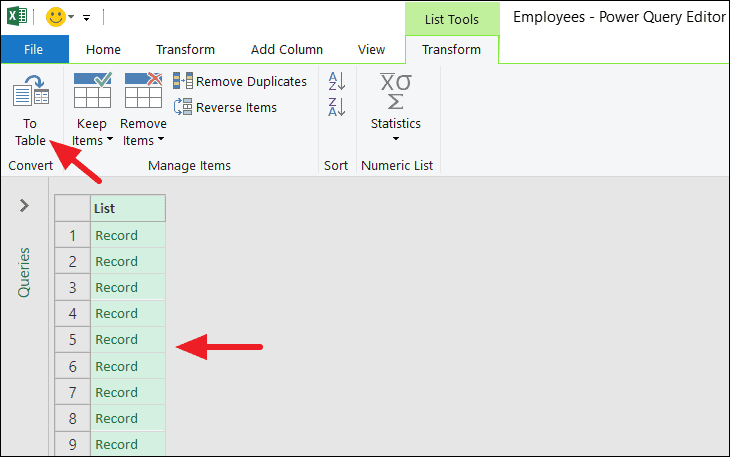
Step 3: Once the file is loaded, the Power Query Editor will open. You will see your data organized as a list, but the details are not yet expanded. To convert the list into a table format, click on To Table in the upper-left corner of the editor.
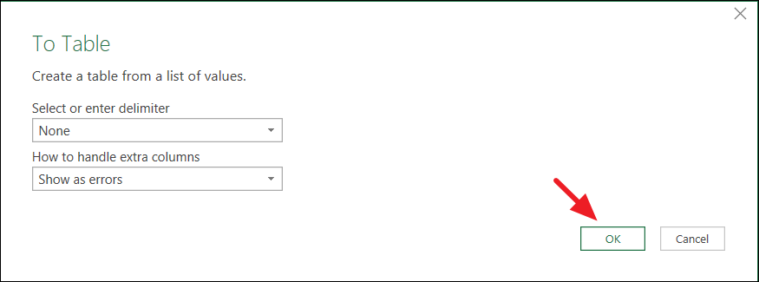
Step 4: In the 'To Table' dialog box that appears, you can leave the default settings and click OK.
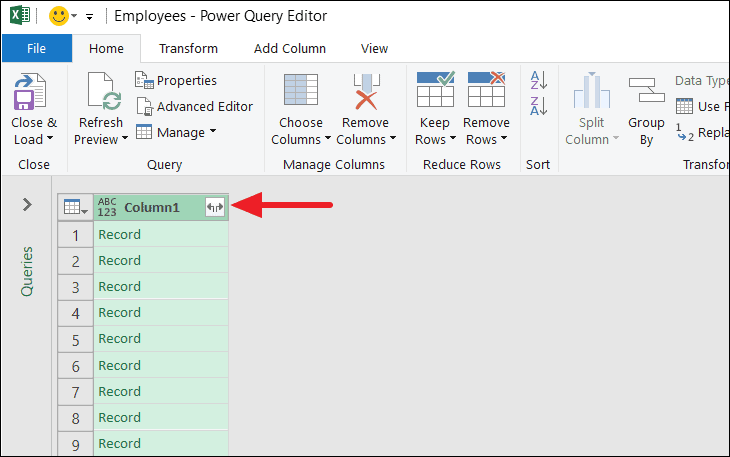
Step 5: Now that your data is in a table, you need to expand the records to see the actual data. Click on the expand icon (two arrows pointing outward) at the top of the first column.
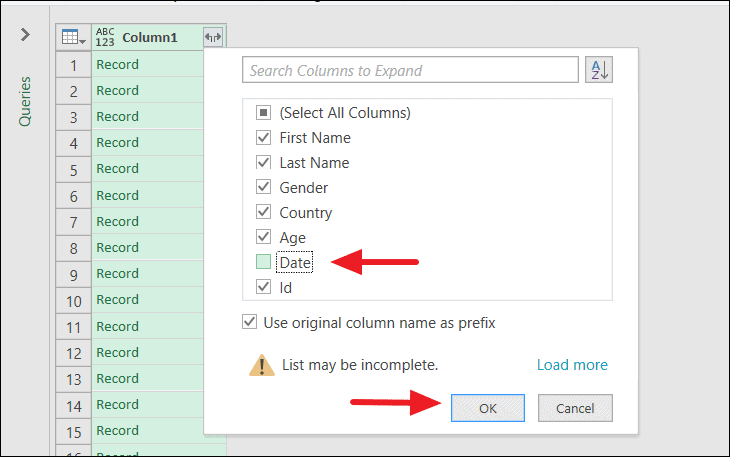
Step 6: A menu will appear showing all the available columns from your JSON data. Select the columns you wish to include by checking the boxes next to them. You can uncheck any columns you want to exclude. Once you've made your selection, click OK.
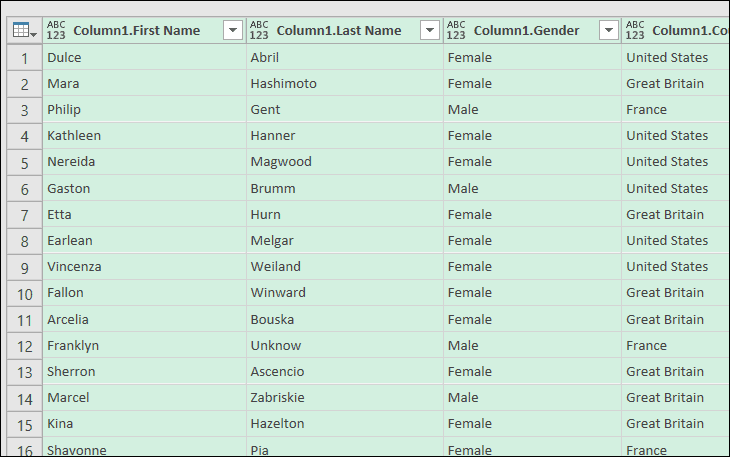
Your data will now be displayed with the selected columns expanded into a structured table.
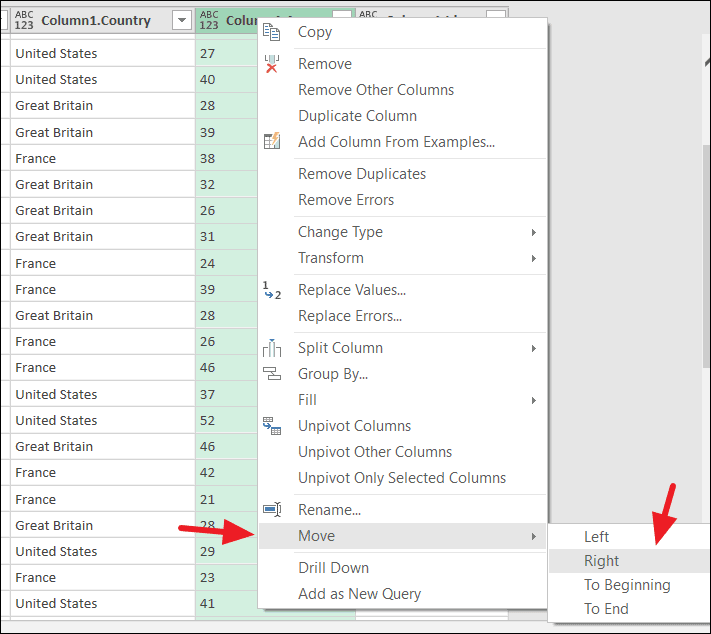
Step 7: To rearrange the columns, right-click on the header of the column you wish to move, select Move, and choose the desired placement option (e.g., Left, Right, To Beginning, or To End).
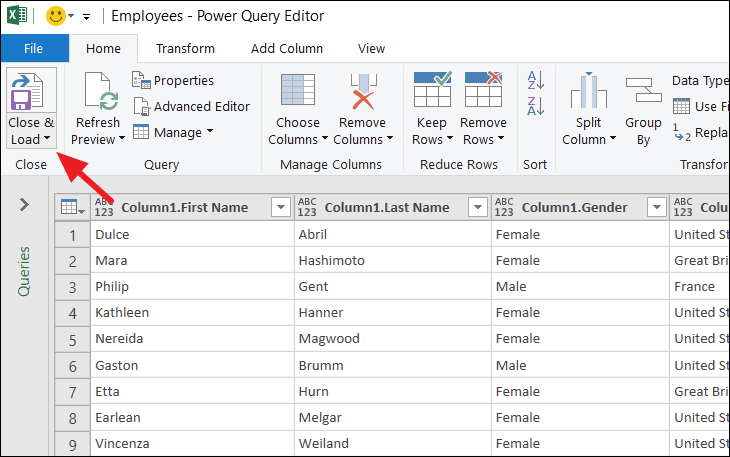
Step 8: After organizing the data to your preference, click on Close & Load in the upper-left corner under the Home tab to import the data into your Excel worksheet.
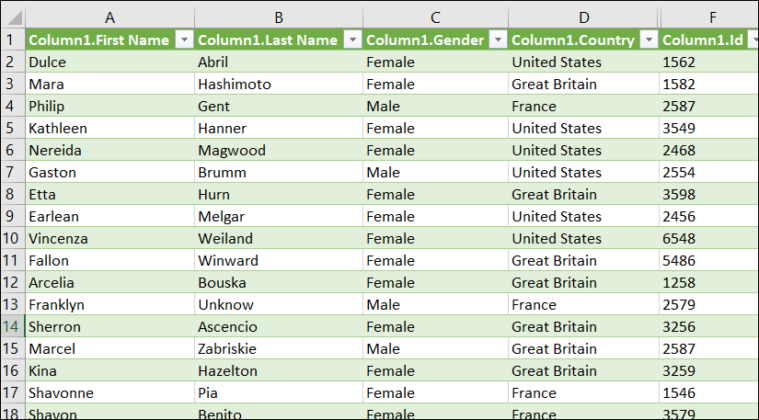
The JSON data is now successfully imported into Excel and ready for analysis.
Online Tools for JSON to Excel Conversion
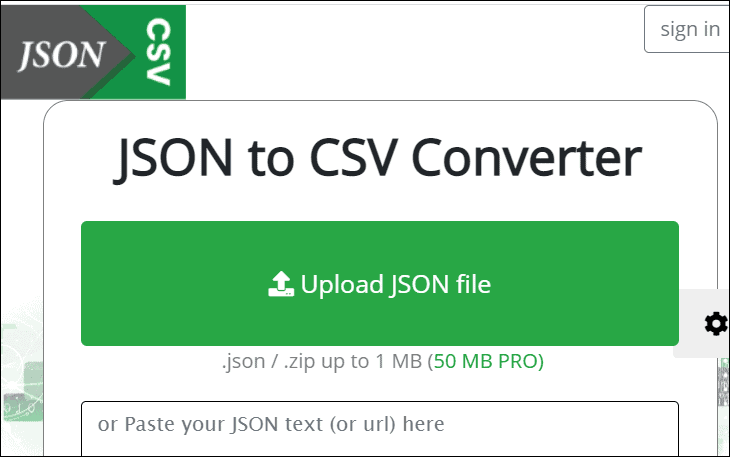
If you prefer a quick conversion without using Excel's built-in features, several online tools can convert JSON files to Excel format efficiently. One such tool is json-csv.com.
Step 1: Visit json-csv.com in your web browser. Click on the Upload JSON file button to select your JSON file from your local system.
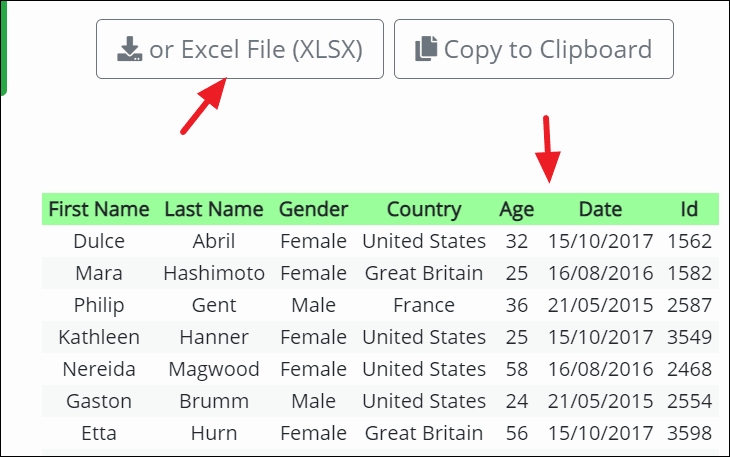
Step 2: Once the file is uploaded, the website will display a preview of your data in table format. Review the data to ensure it appears correctly.
Step 3: Click on the Excel File (XLSX) button to download the converted Excel file to your computer.
The downloaded file will contain your JSON data in Excel format, ready for use.
Using online converters is a convenient option when you need a quick solution without accessing Excel or when you're working on a device without Excel installed. However, be cautious with sensitive data, as uploading files to third-party websites can pose security risks.