Descriptive statistics summarizes the given data and provides a summary of key statistics for the data such as mean, mode, median, Variance, standard deviation, Skewness, Count, maximum and minimum, etc. When working with a large dataset, knowing key statistical information about your dataset and trends in your data could be useful.
Microsoft Excel has various built-in functions that can calculate many statistical values individually such as mean, variance, count, etc. Excel also has an add-in tool called Analysis Toolpak that helps you generate all descriptive statistics in one go. In this article, we will explain how to calculate descriptive statistics for your data in Excel.
How to Install Data Analysis Tool to Excel
Data Analysis (or Data Statistics) is an advanced data analysis tool that takes a large amount of data and calculates a series of key statistics of the data set. The Data Analysis Tool can be accessed from the Data tab of the Excel program. Before you can use the Data Analysis tool, you need to install an add-in called Data Analysis ToolPak. Here’s how you can install Data Analysis ToolPak in Excel.
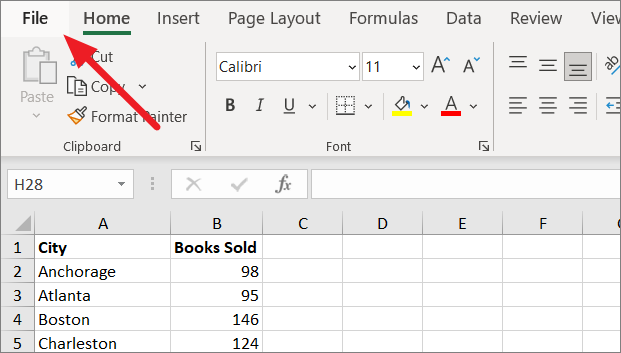
First, go to the ‘File’ tab in the top left corner.
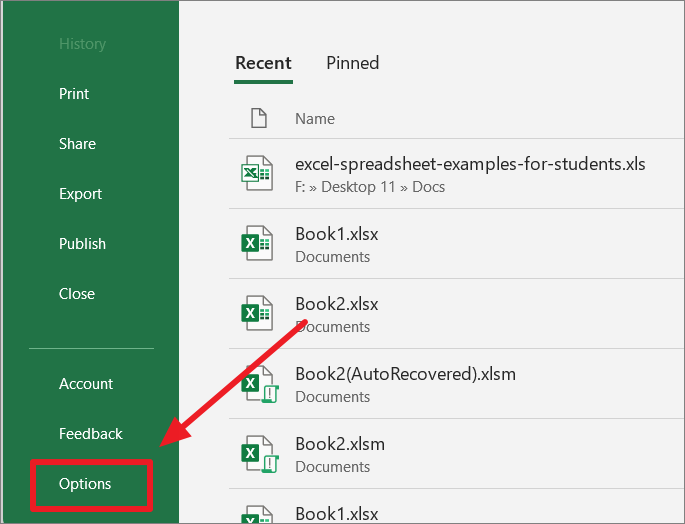
Then, click on ‘Options’ at the bottom of the left panel.
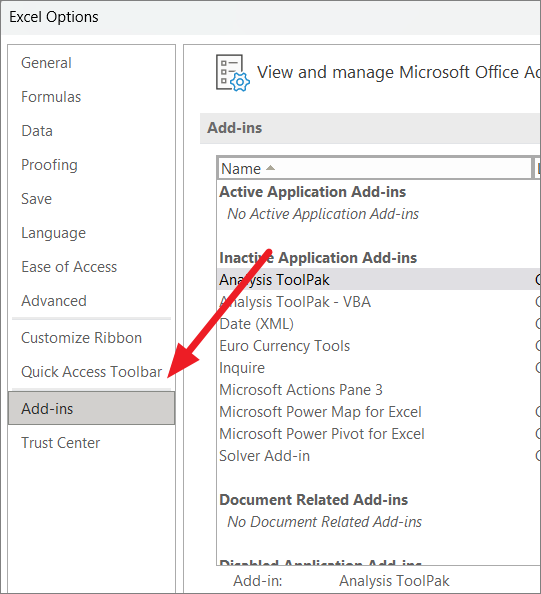
When the Excel Options dialog box appears, click on ‘Add-ins’ in the left pane.
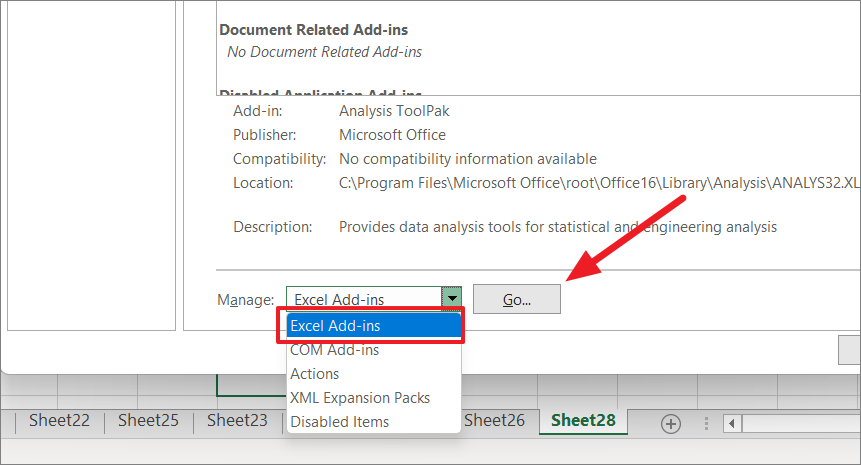
At the bottom of the right pane, choose ‘Excel Add-ins’ from the Manage drop-down and click on ‘Go..’.
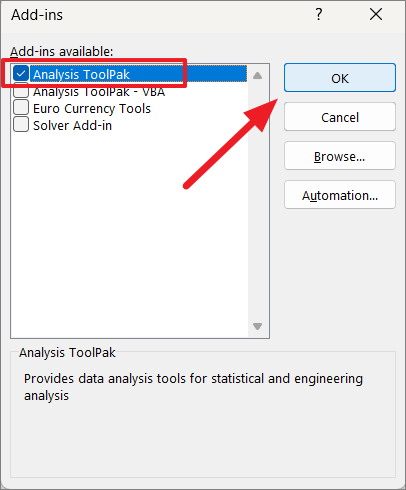
A new Add-ins dialog box will pop up. Here, tick or select the ‘Analysis ToolPak’ option and click ‘OK’.
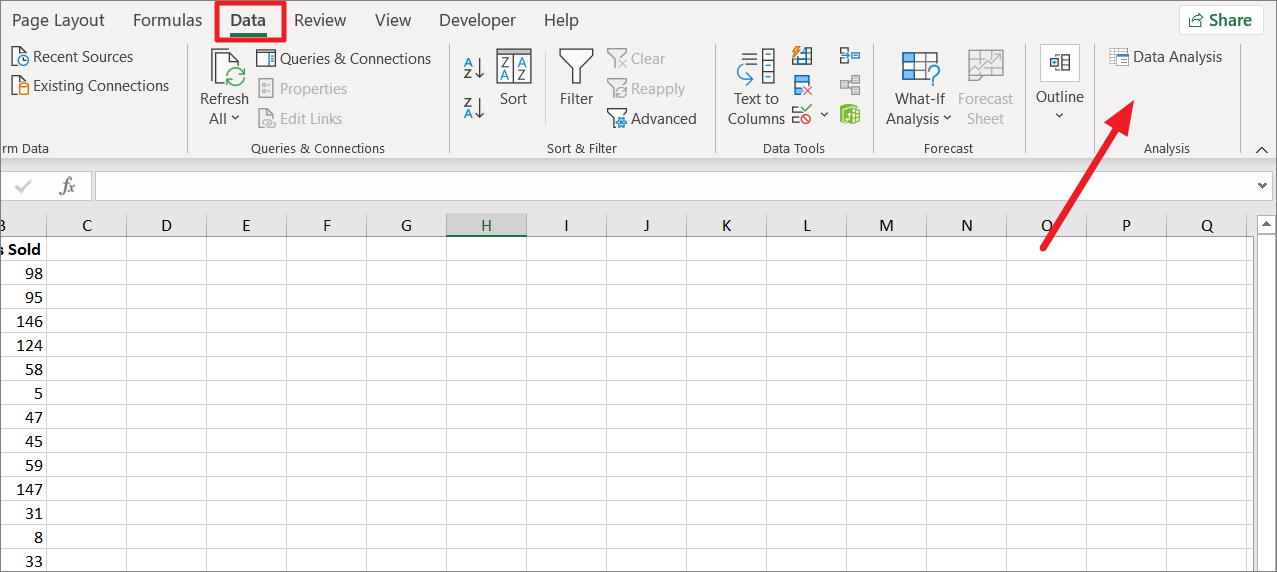
Once you do that, the ‘Data Analysis’ tool will appear in the right corner of the Ribbon under the ‘Data’ tab.
How to Get Descriptive Statistics in Excel
Once the Data Analysis tool is enabled, you can calculate descriptive statistics for your data set.
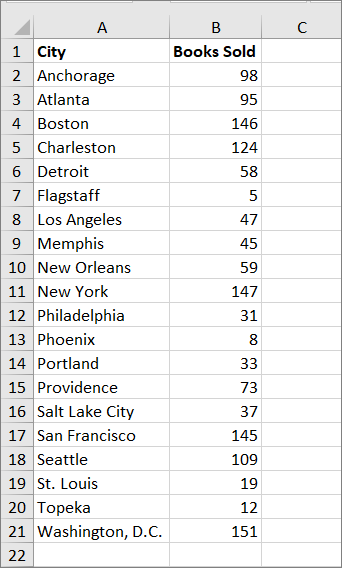
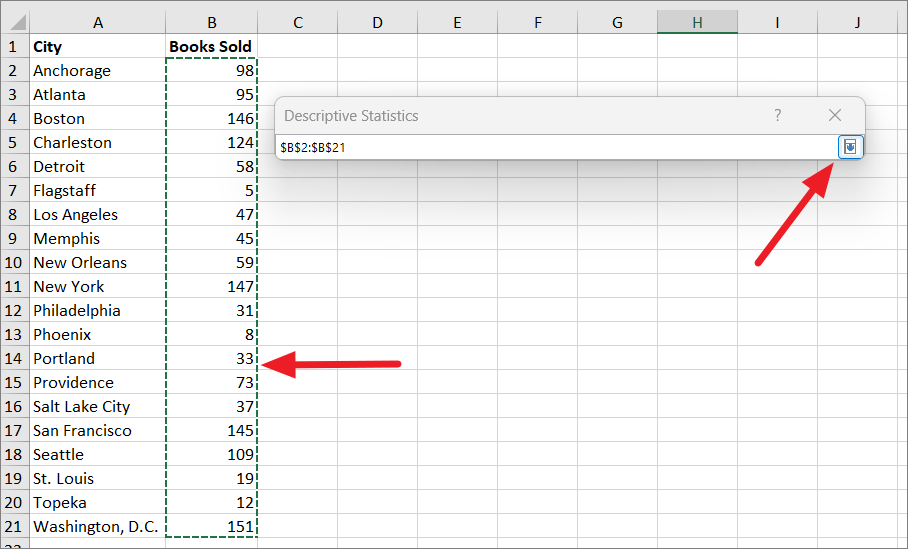
Suppose, you have the below sample data set where we have the number of books sold in different cities. For this data set, we want to calculate descriptive statistics. Here’s how you can do that:
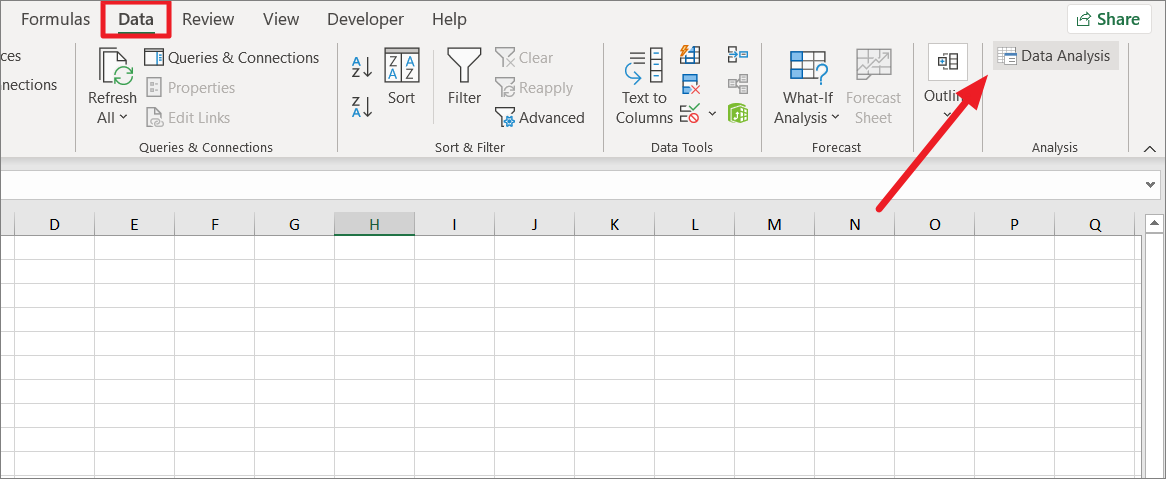
To get Descriptive Statistics, go to the ‘Data’ tab and click the ‘Data Analysis’ tool from the Analysis section.
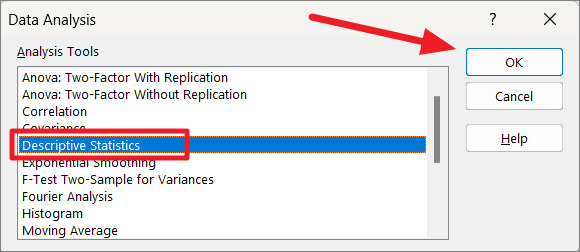
In the Data Analysis dialog window, select ‘Descriptive Statistics’ under Analysis Tools and click ‘OK’.
This will open the Descriptive Statistics dialog box where you need to configure the Input and Output options.
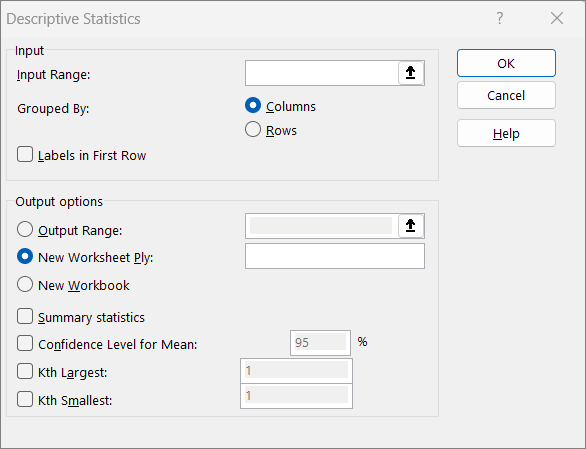
Let’s see how you should fill each field in the Descriptive Statistics dialog box.
Input Range: The input Range is the most important field in the dialog box. For this, select the range of variables/values you want to analyze.
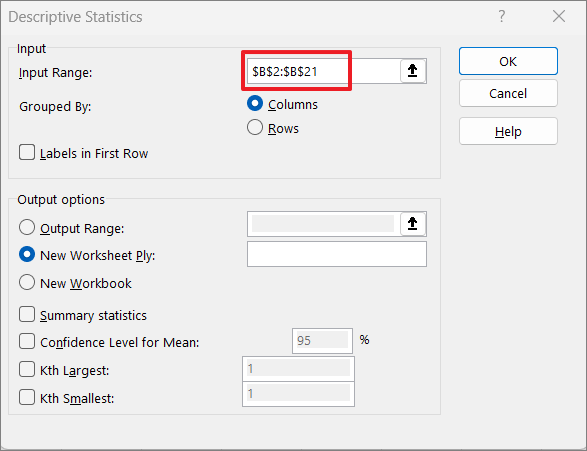
You can manually enter the range in the field or click the upward-facing arrow button at the end of the field to choose a range.
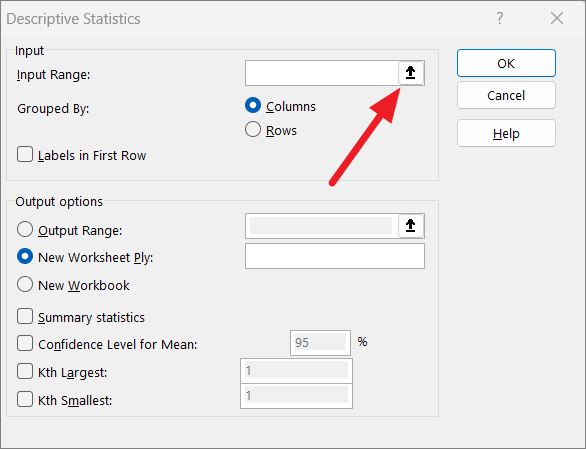
After that, select the range from the sheet and click the downward arrow button to confirm the range.
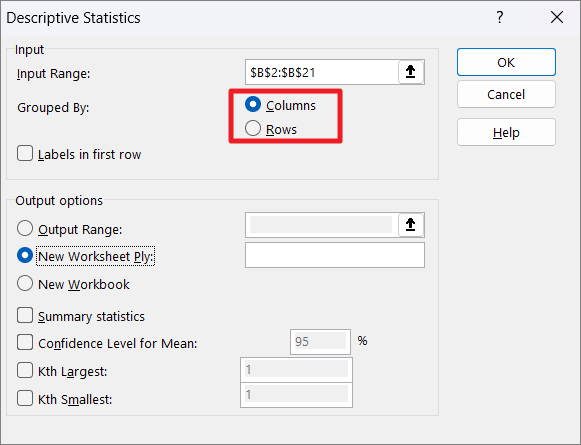
Grouped By: Choose how you want to organize your variables (row or column).
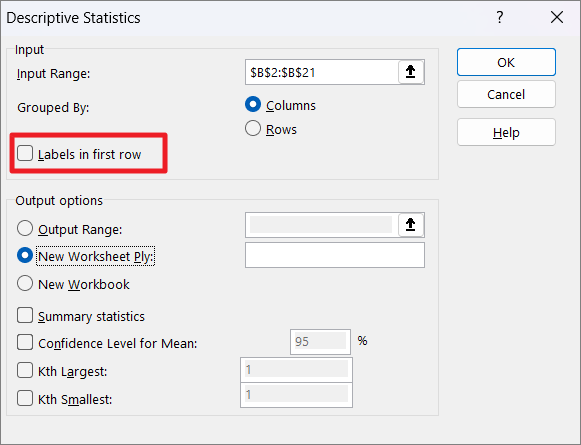
Labels in first row: If you selected or entered the range (in the Input Range) with headers, you should tick this option. In this example, we selected the input range without the labels, so we left it unchecked.
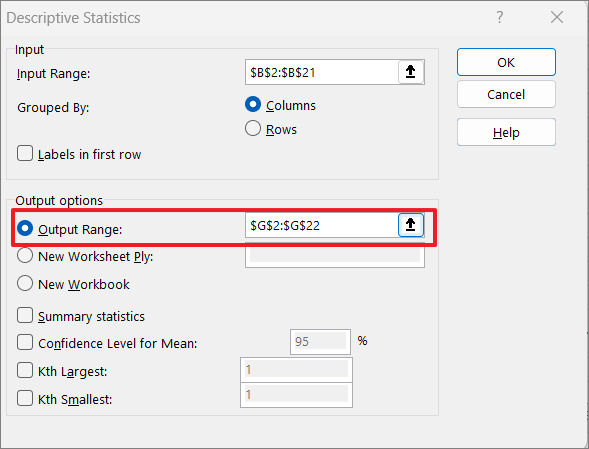
Output Range: Select where you want to display the statistics result. If you want to display the result in the current worksheet or other worksheets, click the ‘Output Range’ radio button and specify the range in the field next to it.
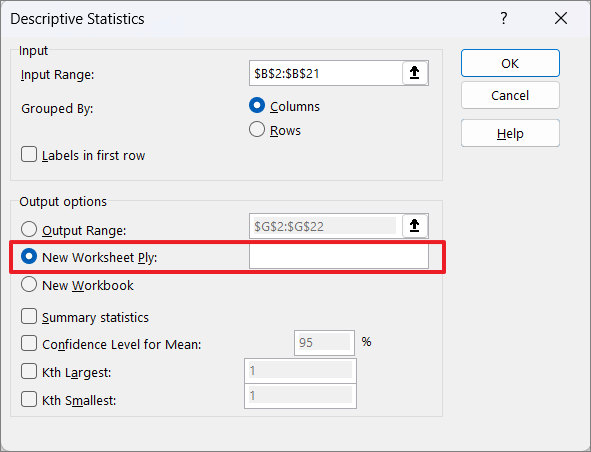
New Worksheet Ply: If you want to show the results in a new spreadsheet, simply select the ‘New Worksheet Ply’ radio button.
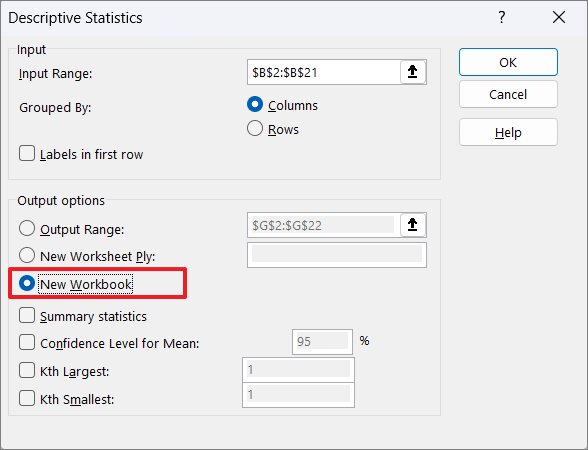
New Workbook: In case you want to display the result in an entirely new workbook, choose the ‘New Workbook’ option.
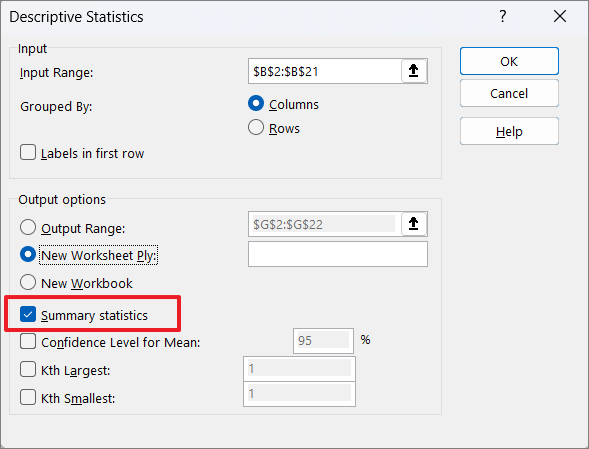
Summary statistics: If you want to calculate and display most of the descriptive statistics (such as mean, mode, dispersion, standard deviation, etc.), then check this option.
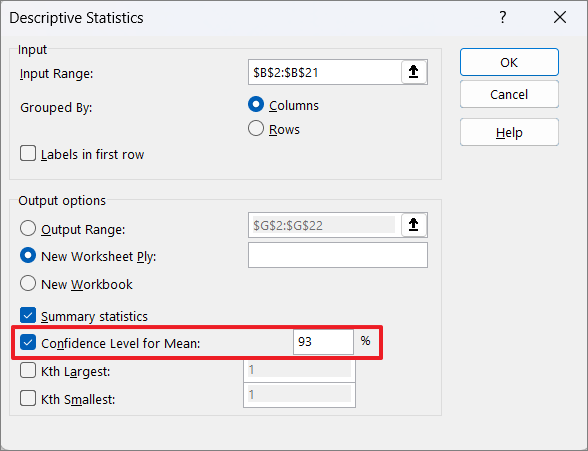
Confidence Level for Mean: Select this option if you want to display a confidence interval for the mean. Then, enter the confidence level you want to be calculated for the sample mean. The default is 95%.
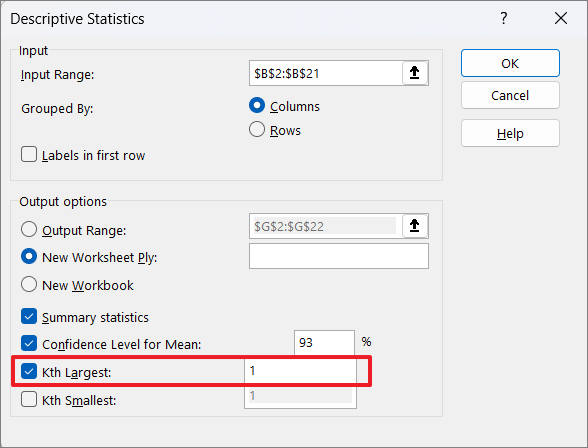
Kth Largest: This option will display the largest value in the data set. When you select this option, the default value is 1 which means it will display the first largest value. If you enter ‘2’, it will display the second largest value, 3 will show the third largest value, and so on.
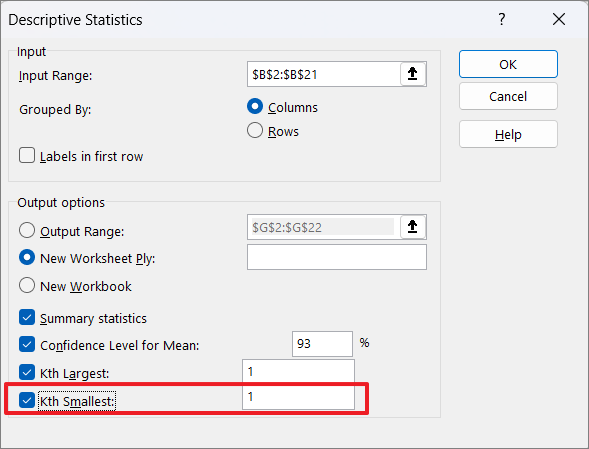
Kth Smallest: This option will display the Smallest value in the data set. The default value is 1 which means it will display the smallest value. If you enter ‘2’, it will display the second smallest value, 3 will show the third smallest value, and so on.
Finally, click ‘OK’ to generate the statistics.
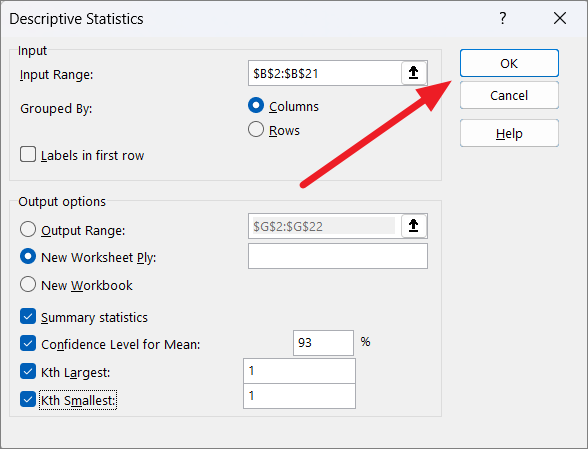
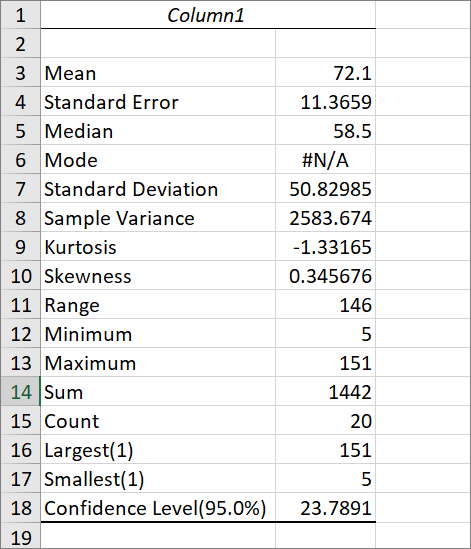
And you will get a summary of Descriptive Statistics as shown below.
How to Read Descriptive Statistics Results
The explanation for each statistical result is as follows:
- Mean – Mean is the average value of your sample data which is calculated by summing all the values in the data set and dividing by the number of values in the sample.
- Standard error – This shows the standard error values of the sample data. It is a measure of how far each population means is likely to be from a sample mean (difference between predicted and actual value).
- Median – This is the middle value in the data set. It is found by arranging the sample in ascending order or descending order and extracting the exact middle value in the list. If the number of values in the list is even-numbered, then the middle two values will be averaged to find the median.
- Mode – This represents the value that appears most frequently in the sample data. This statistical value is useful for categorical and ordinal data. In the above example, there is no most common value, so we get #N/A.
- Standard deviation – It shows the standard deviation of your data set which is a standard difference between each data point and the mean. The higher the standard deviation, the higher the variability.
- Sample Variance – Sample Variance is the average of squared standard deviations.
- Kurtosis – Kurtosis value is a measure of how tips/peaks and tails of your distribution differ from the normal distribution. The normal distribution usually has a Kurtosis value of 0. If the kurtosis value is positive, it means your distribution is a peaked distribution and negative values indicate a relatively flat distribution.
- Skewness – Skewness represents the asymmetry of your distribution where 0 indicates a perfectly symmetrical distribution. If the Skewness value is greater than 0 (positive), your distribution is positively skewed, or to the right. If the Skewness value is less than 0, your distribution is negatively skewed, or to the left.
- Range – The range represents the difference between the largest and smallest values in your data. It is found by subtracting the lowest value from the highest value in the data set.
- Minimum – It is the lowest value in your data set.
- Maximum – It is the highest value in your data set.
- Sum – The sum is simply the total of all the values in the data set.
- Count – This is count the number of all the values in your data.
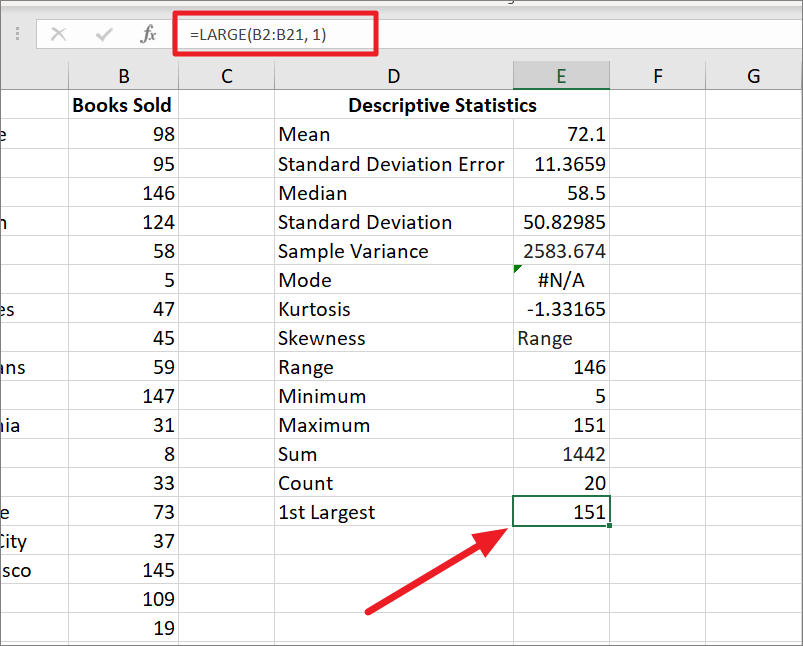
- Largest – It indicates the largest number in your data set based on the number you chose for the ‘Kth Largest’ option during setup.
- Smallest – It indicates the smallest number in your data set based on the number you chose for the ‘Kth Smallest’ option during setup.
- Confidence Level (95.0%) – Confidence level indicates the range of values that may contain a population parameter or mean.
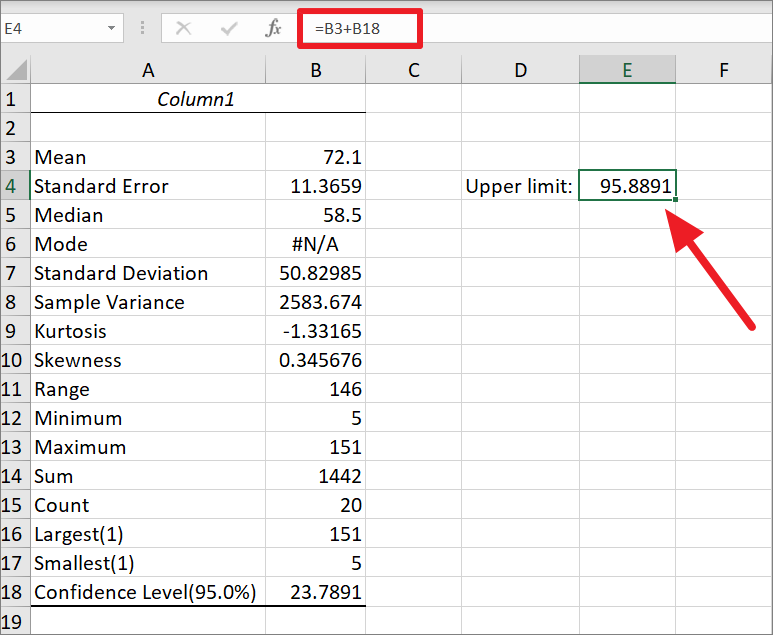
You can also find the upper and lower limits of the confidence interval using the Confidence Level value from the results.
To get the upper limit of the confidence interval, simply add the mean with the value of the confidence level. To do that, use a similar formula – =B3+B18, which results in 95.8891.
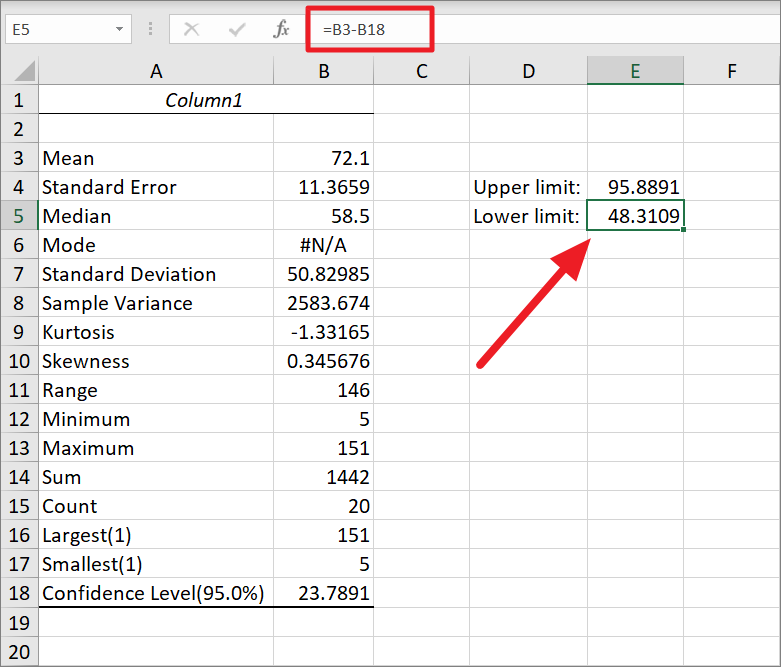
To get the lower limit of the confidence interval, simply subtract the mean from the value of the confidence level. To do that, use a similar formula – =B3-B18, which results in 48.3109.
Calculate Individual Statistics using Formulas
The Data Analysis tool enables you to perform advanced analysis on your data and automatically generate a series of 16 key statistics for your data. But if you only want to find certain statistics for your data (such as means, Standard deviation, etc), you can use individual formulas to calculate each statistical measure. These formulas will produce the same result as the Data Analysis tool.
Here’s a list of formulas to calculate descriptive statistics in Excel:
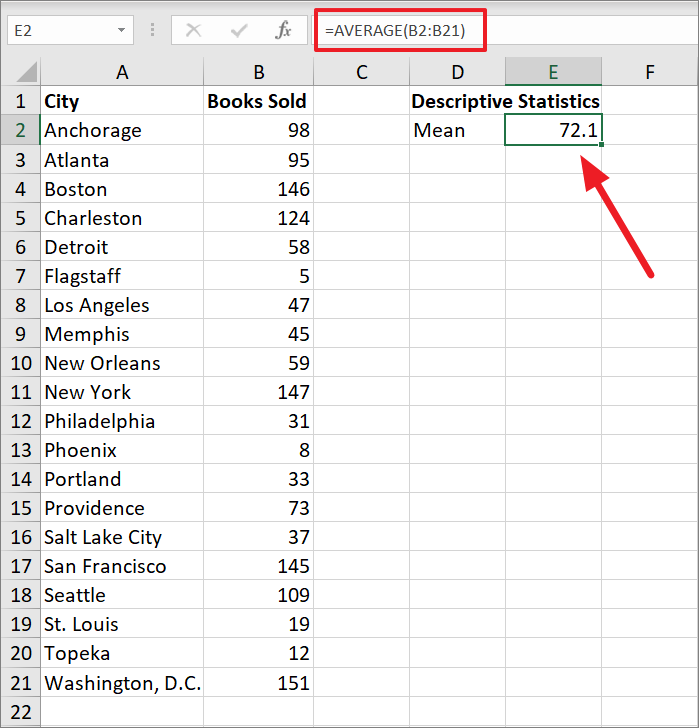
Mean:
=AVERAGE(B2:B21)Where replace B2:B21 with the range of values in your sample.
Standard Deviation Error:
=STDEV.S(B2:B21)/SQRT(COUNT(B2:B21))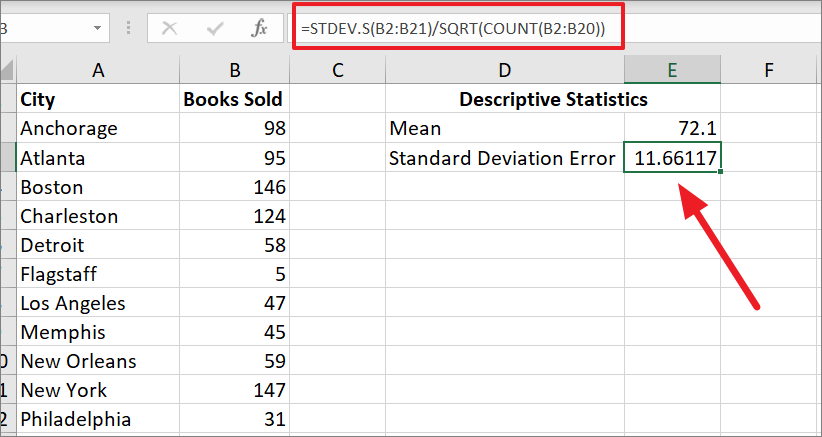
Median:
=MEDIAN(B2:B21)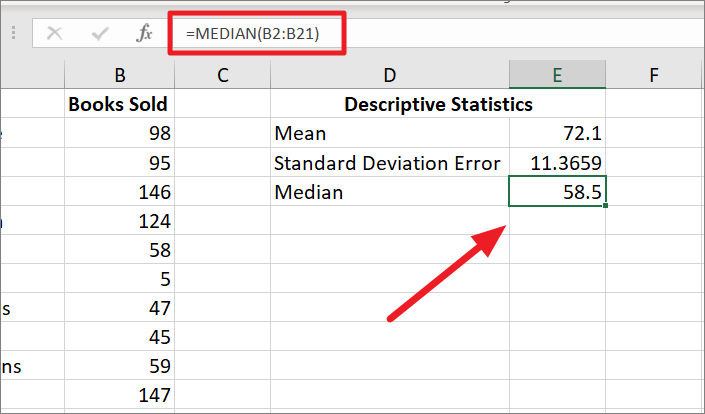
Standard deviation:
=STDEV.S(B2:B21)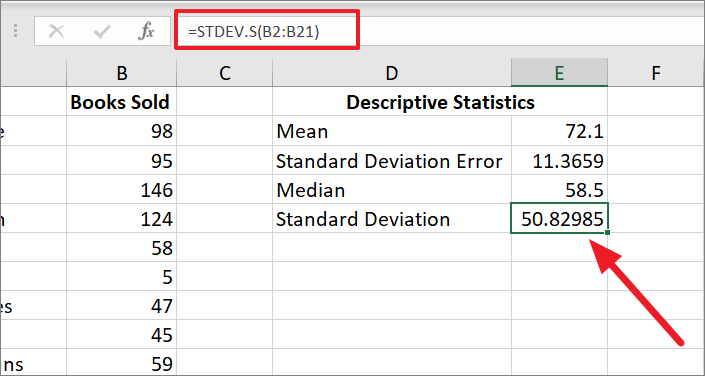
Sample Variance
=VAR.S(B2:B21)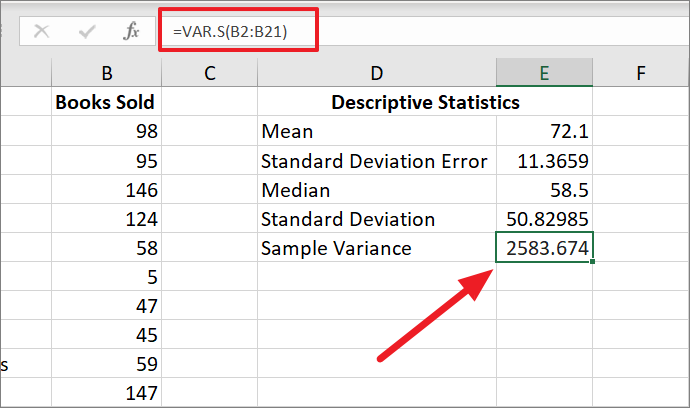
Mode:
=MODE.SNGL(B2:B21)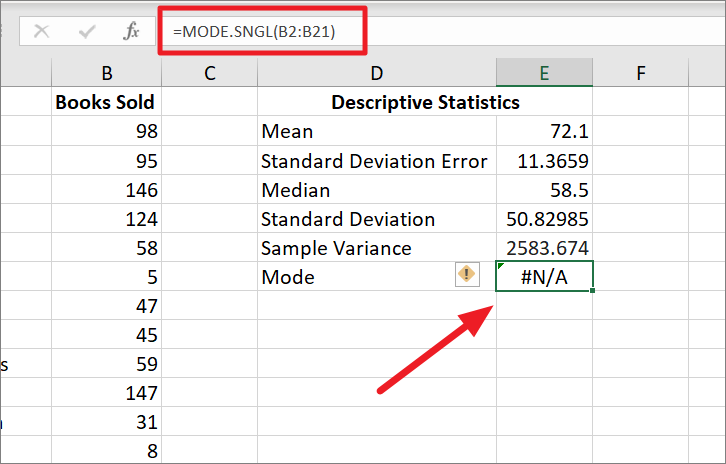
Kurtosis:
=KURT(B2:B21)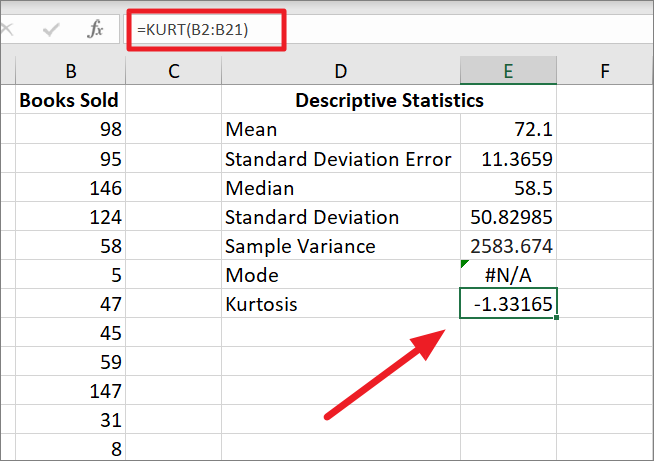
Skewness:
=SKEW(B2:B21)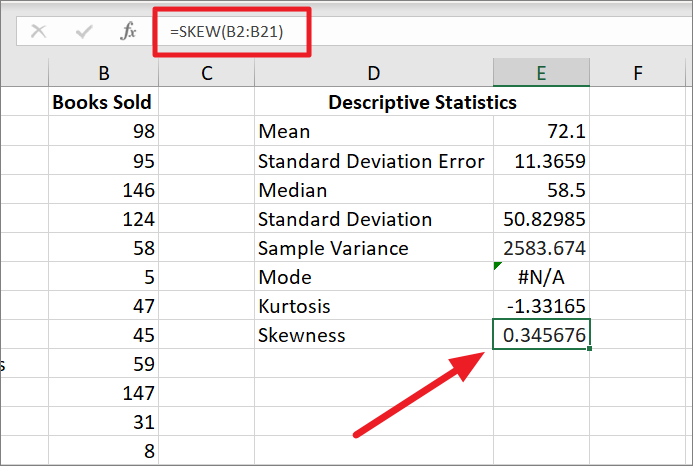
Range:
=MAX(B2:B21)-MIN(B2:B21)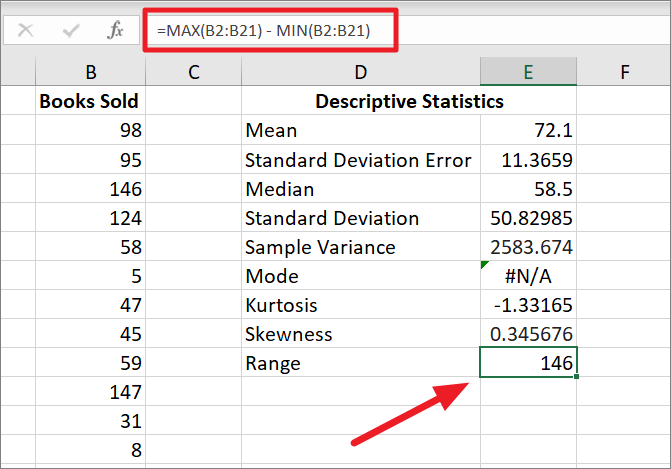
Minimum:
=MIN(B2:B21)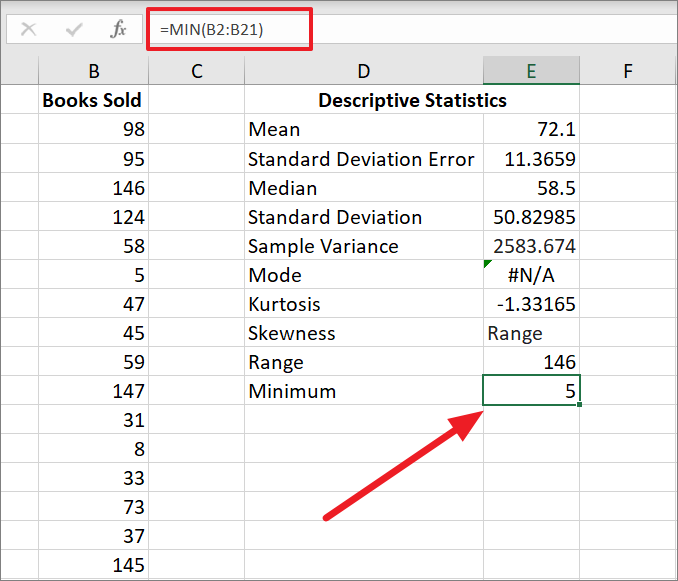
Maximum:
=MAX(B2:B21)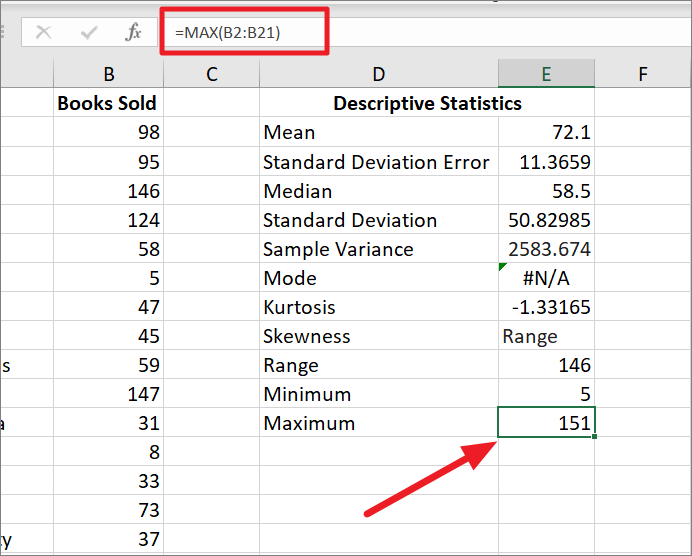
SUM:
=SUM(B2:B21)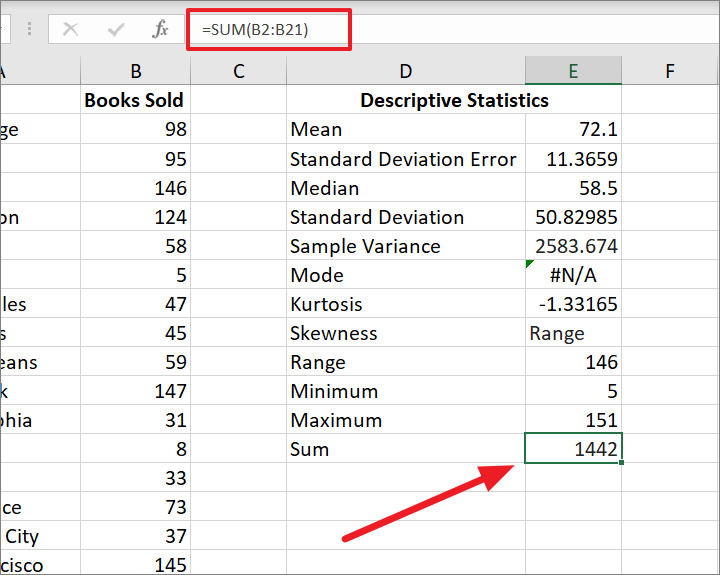
Count
=COUNT(B2:B21)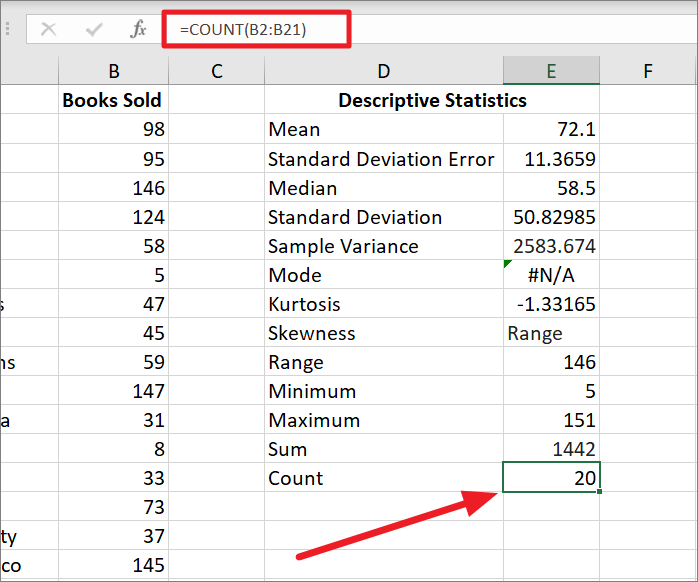
1st Largest Value
=LARGE(B2:B21,1)Where replace 1 with the kth largest number. For example, if you want to find the first largest value enter 1, 2 for the second largest value, and so on.
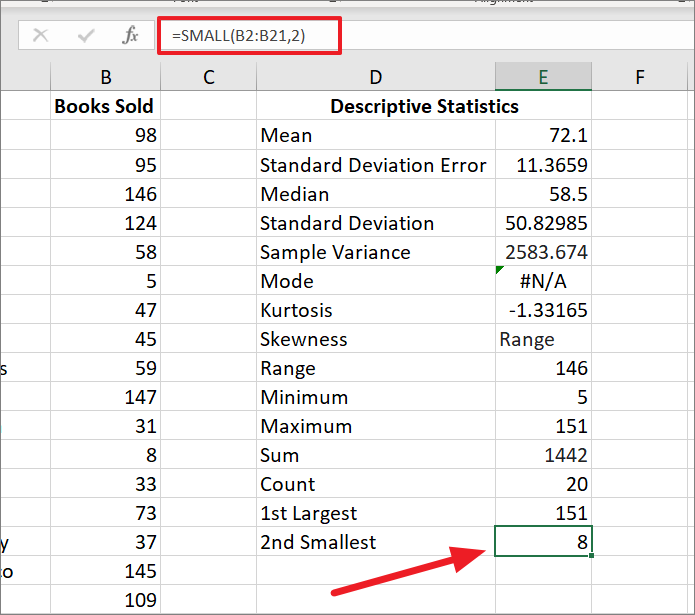
2nd Smallest
=SMALL(B2:B21,2)Where replace 2 with the kth smallest number.
Thats’ it.


