
Saving Excel charts as image files streamlines the process of adding polished visuals to reports, presentations, and websites. Exported images preserve chart formatting, prevent accidental edits, and offer broad compatibility for sharing or integrating with other applications. Whether you need a single chart or dozens, Excel provides several approaches to exporting charts as images, each with distinct advantages for quality, speed, and flexibility.
Export a Chart as an Image Using Excel’s Built-In “Save as Picture” Feature
Save as Picture….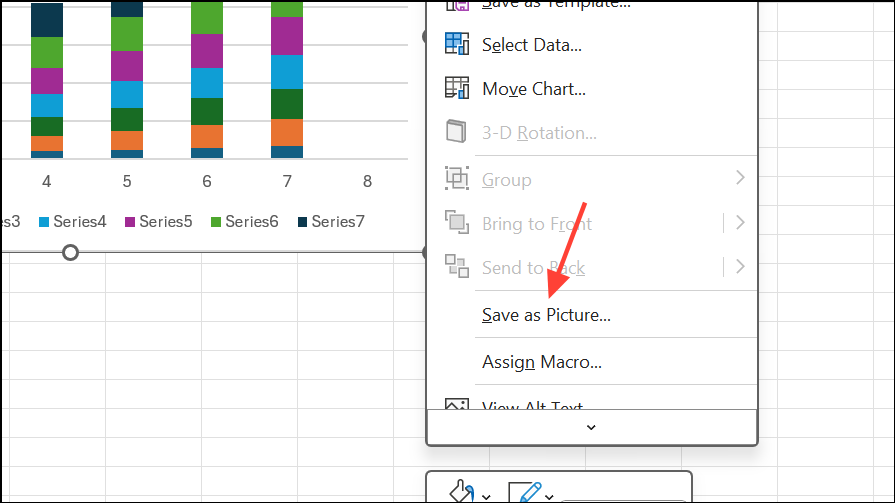
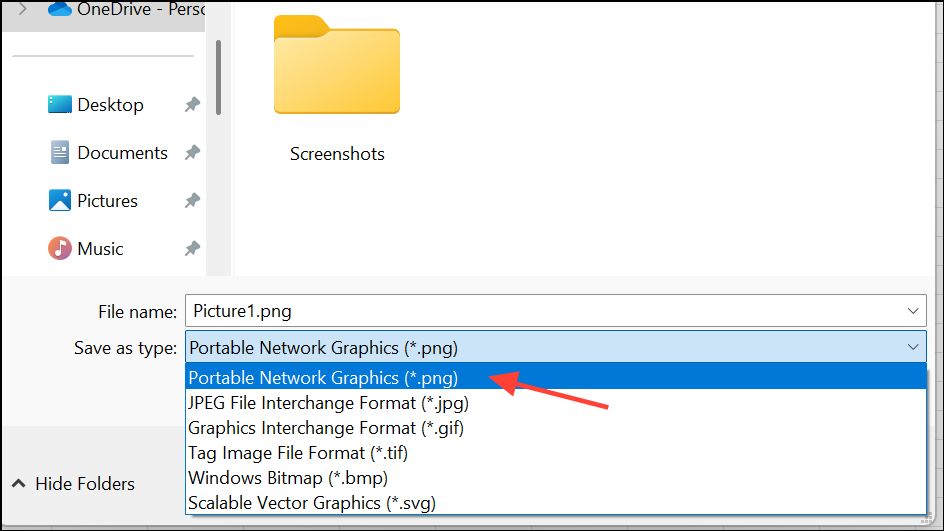
Save. The chart is now exported as a standalone image, ready for use in emails, documents, or web pages.This method delivers a high-quality image that maintains the chart’s original formatting, making it suitable for professional presentations and publications.
Copy and Paste the Chart into a Graphics Editor
Ctrl+V to paste the chart.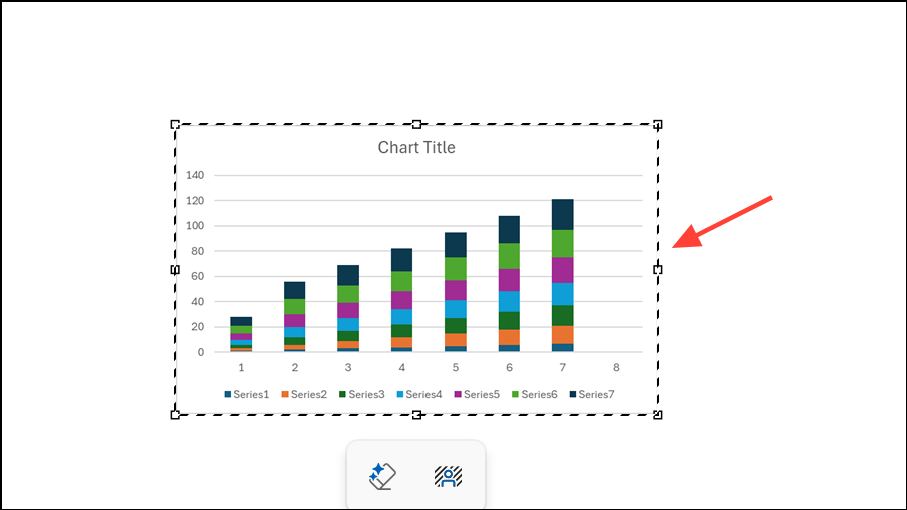
This approach gives you more control over post-processing, such as adding annotations or combining multiple charts into one image. It’s especially useful when you want to make visual adjustments before saving.
Export Charts Using VBA Macro for Automation
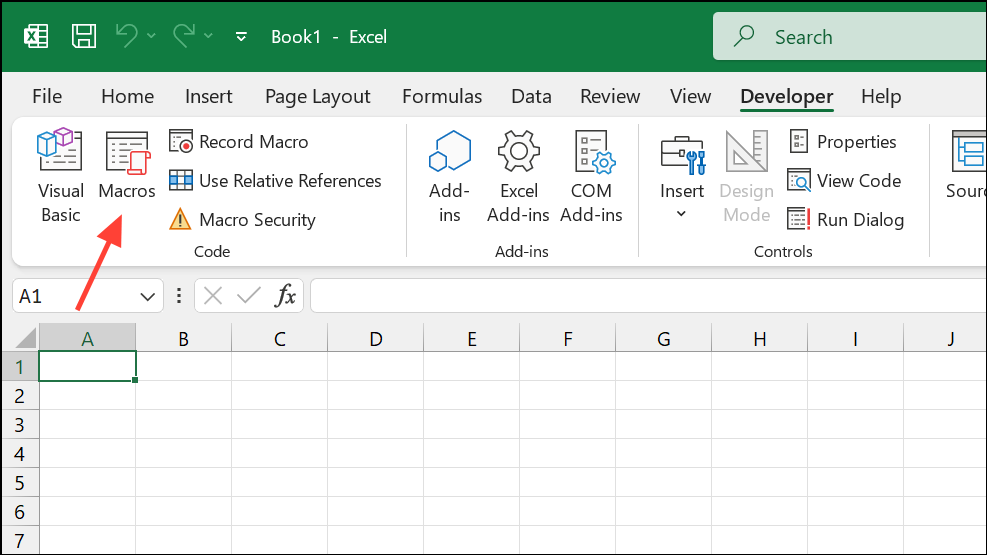
If you routinely export charts, automating the process with a VBA macro can save significant time and reduce manual errors.
File > Options > Customize Ribbon and checking Developer in the right column.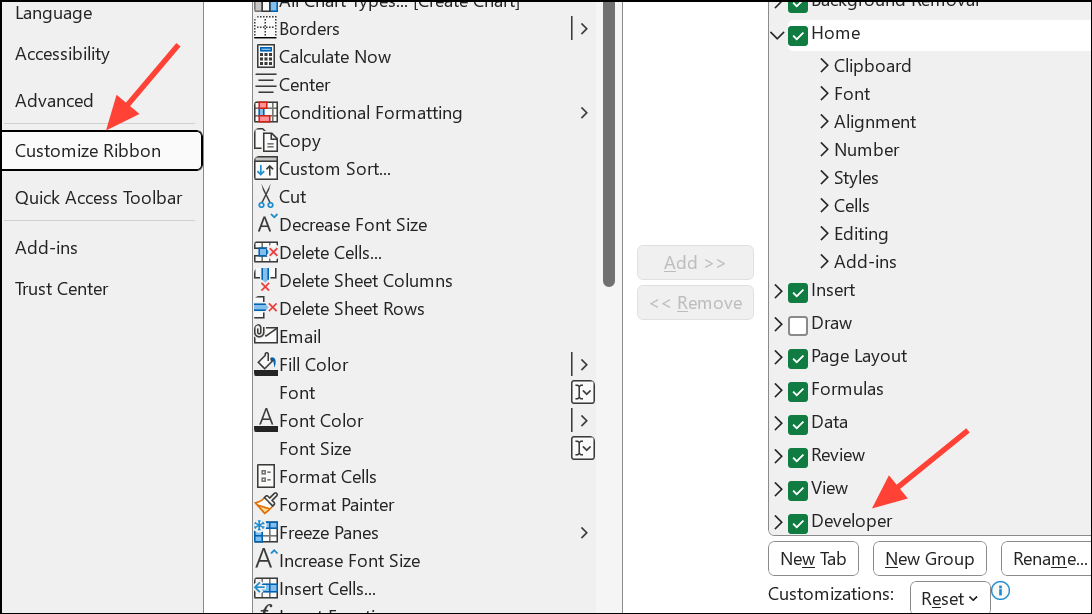
ActiveChart.Export "D:\My Charts\SpecialChart.png"
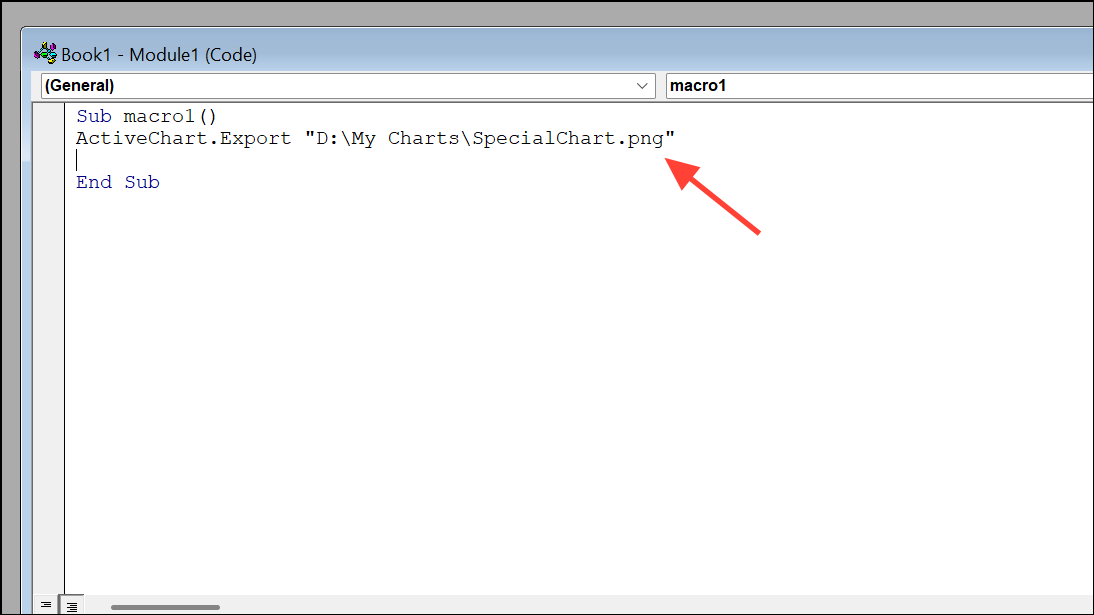
.xlsm), select the chart, and run the macro from the Developer tab. The image will appear in your specified folder. Change the file extension in the code to .jpg or .gif for other formats.This method streamlines repetitive export tasks and is ideal for batch processing charts.
Copy as Picture Feature in Excel
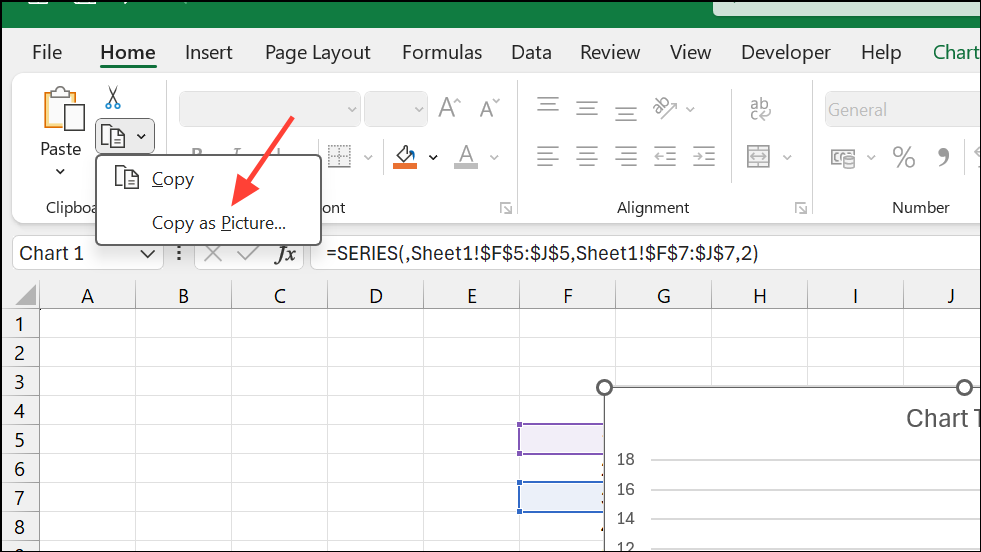
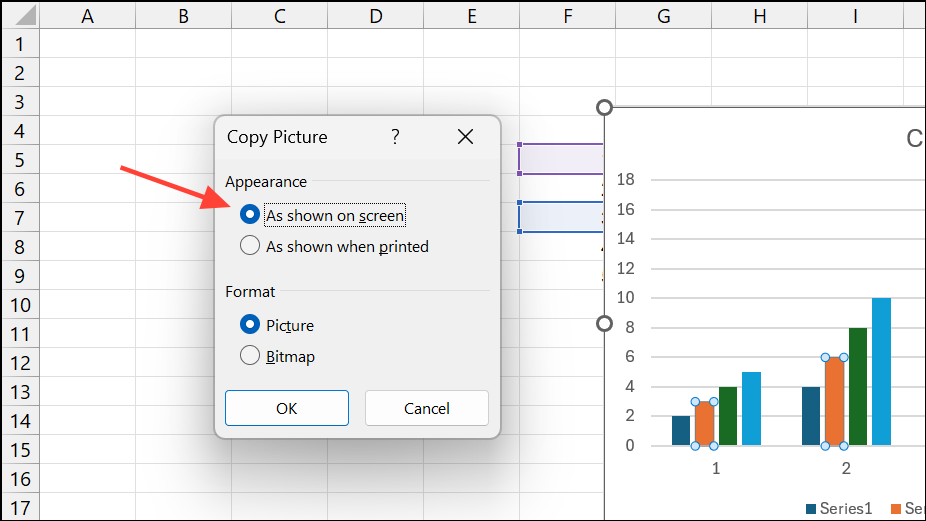
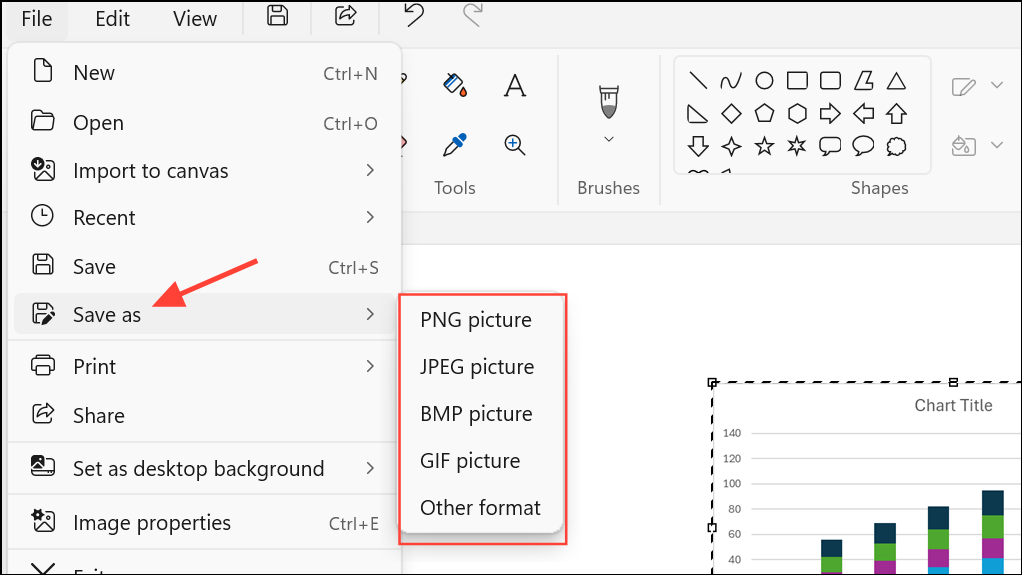
OK, then paste (Ctrl+V) into any document, email, or graphics editor. Save the resulting image from the editor as needed.This built-in feature is especially useful when you want to capture not just charts, but also formatted ranges or objects as static images.
Export Multiple Charts at Once with Add-ins
Third-party Excel add-ins such as Macabacus provide a fast way to export multiple charts simultaneously, saving time and ensuring consistent file naming.
This option is ideal for users who frequently need to export large numbers of charts, such as in financial modeling or analytics workflows.
Export Charts as Images Using Python Automation (Windows Only)
For advanced users, Python can automate chart export via the win32com library. This method requires Excel installed on Windows and is suitable for batch processing from scripts.
import openpyxl
from win32com.client import Dispatch
import pathlib

workbook_file_name = str(pathlib.Path().resolve()) + r"\yourfile.xlsx"
app = Dispatch("Excel.Application")
workbook = app.Workbooks.Open(Filename=workbook_file_name)

for i, sheet in enumerate(workbook.Worksheets):
    for chartObject in sheet.ChartObjects():
        chartObject.Chart.Export(str(pathlib.Path().resolve()) + "\chart" + str(i+1) + ".png")

workbook.Close(SaveChanges=False)
app.Quit()
This approach is powerful for integrating Excel chart export into automated data pipelines, but requires some programming experience.
Best Practices for Exporting High-Quality Chart Images
- Refine chart formatting—adjust colors, labels, fonts, and sizing before exporting.
- Choose PNG for lossless quality and transparency, or JPEG for smaller file sizes.
- Check image resolution and dimensions; use higher resolution for print materials.
- Avoid multiple rounds of compression to prevent quality loss.
- Test exported images on both screen and in print to confirm clarity and color accuracy.
Exporting Excel charts as images improves workflow flexibility, supports consistent branding, and simplifies sharing across platforms. Select the method that fits your workflow and technical comfort—whether it’s a quick right-click or a fully automated script, you’ll get reliable, high-quality chart visuals every time.


