System slowdowns, laggy applications, and even freezes often occur when Windows 11 runs low on available RAM. Pinpointing which programs are using the most memory is crucial for resolving performance issues, especially when Task Manager and Resource Monitor don’t clearly account for all the RAM in use. Here’s a comprehensive guide to accurately check RAM usage by programs and processes in Windows 11, including advanced techniques for tracking down hidden or “unaccounted for” memory consumption.
Use RAMMap to Get a Complete Memory Usage Breakdown
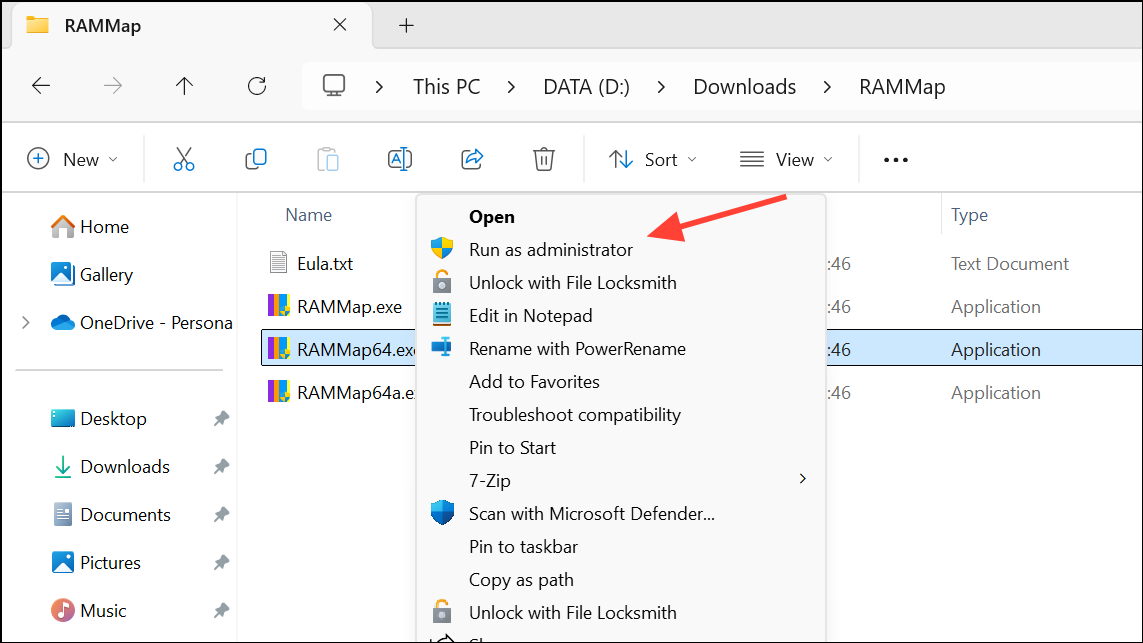
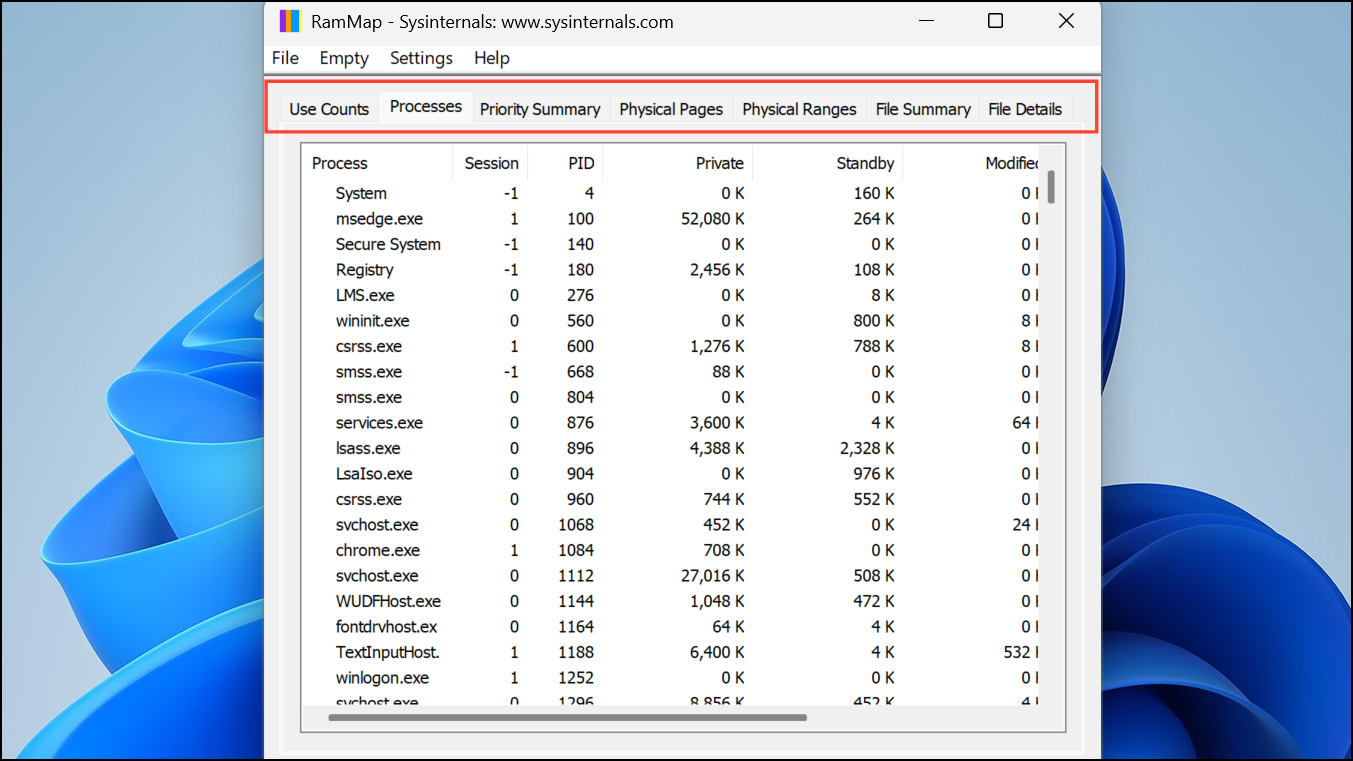
RAMMap, a free utility from Microsoft Sysinternals, provides a detailed and accurate view of how Windows 11 allocates RAM. Unlike Task Manager, which often only shows private working sets for processes, RAMMap reveals memory used by drivers, the kernel, and other system components that may not be visible elsewhere.
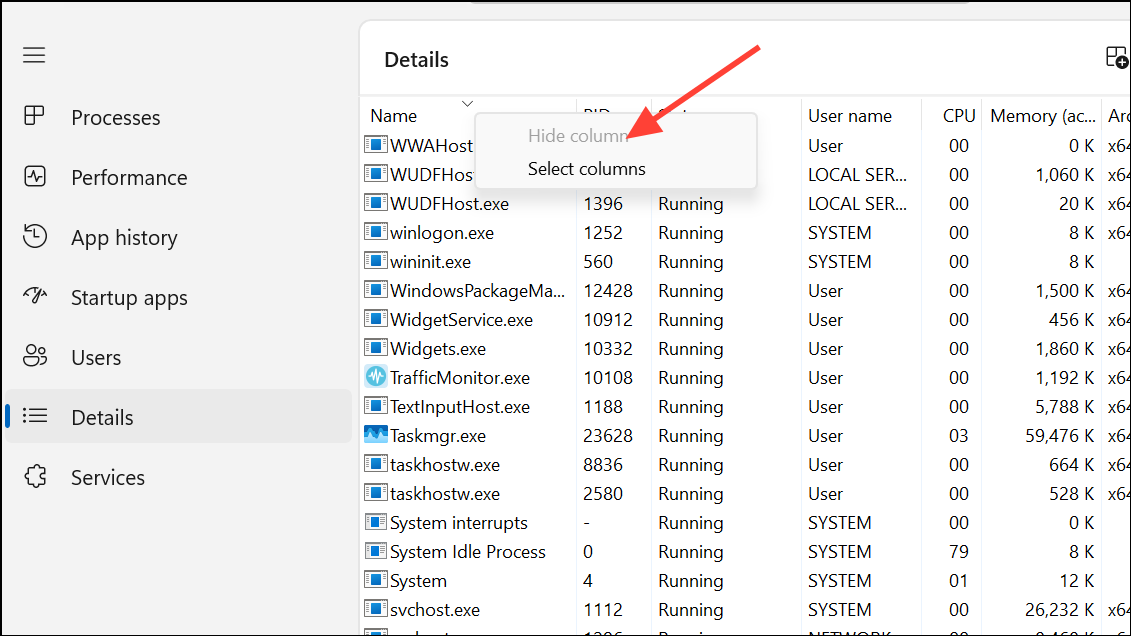
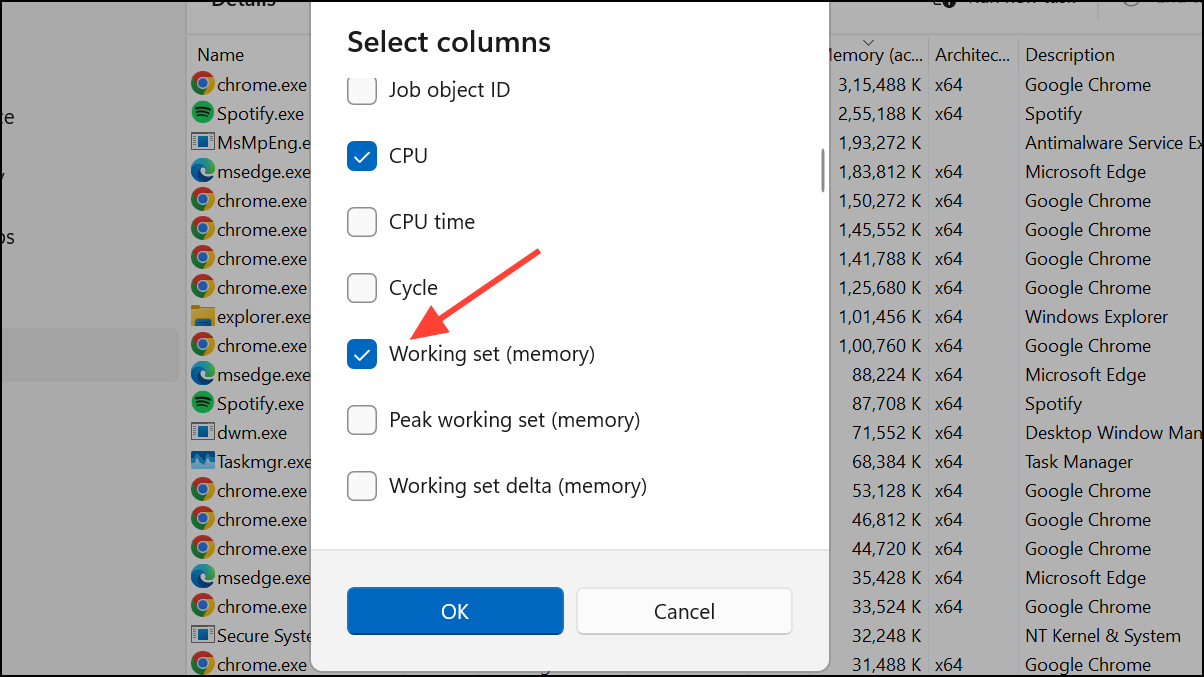
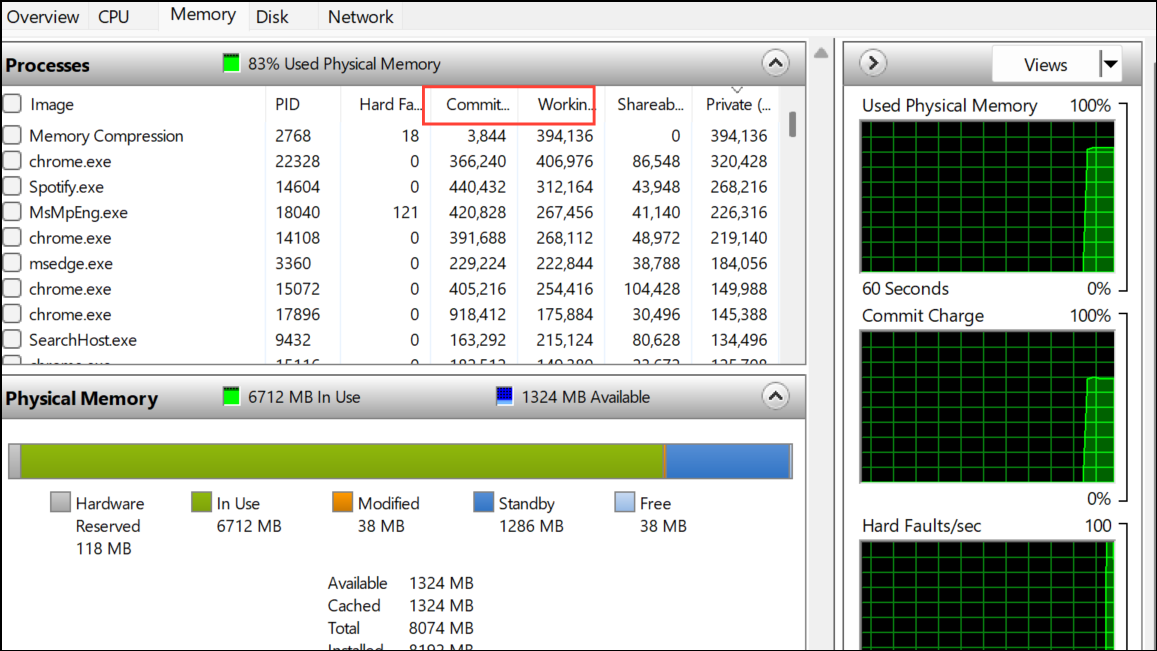
Check Memory Usage in Task Manager’s Details Tab
While Task Manager’s Processes tab gives a general overview, it sometimes misses system processes or fails to account for shared and reserved memory. The Details tab offers a more granular perspective.
Ctrl + Shift + Esc or right-clicking the taskbar and selecting “Task Manager.”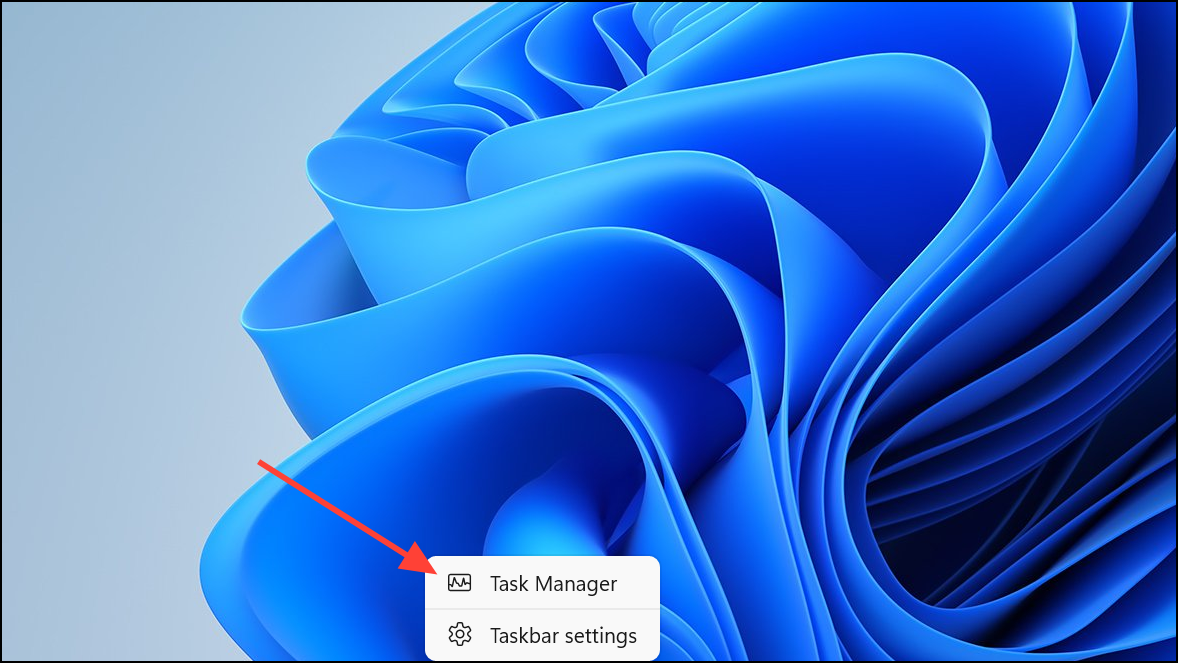
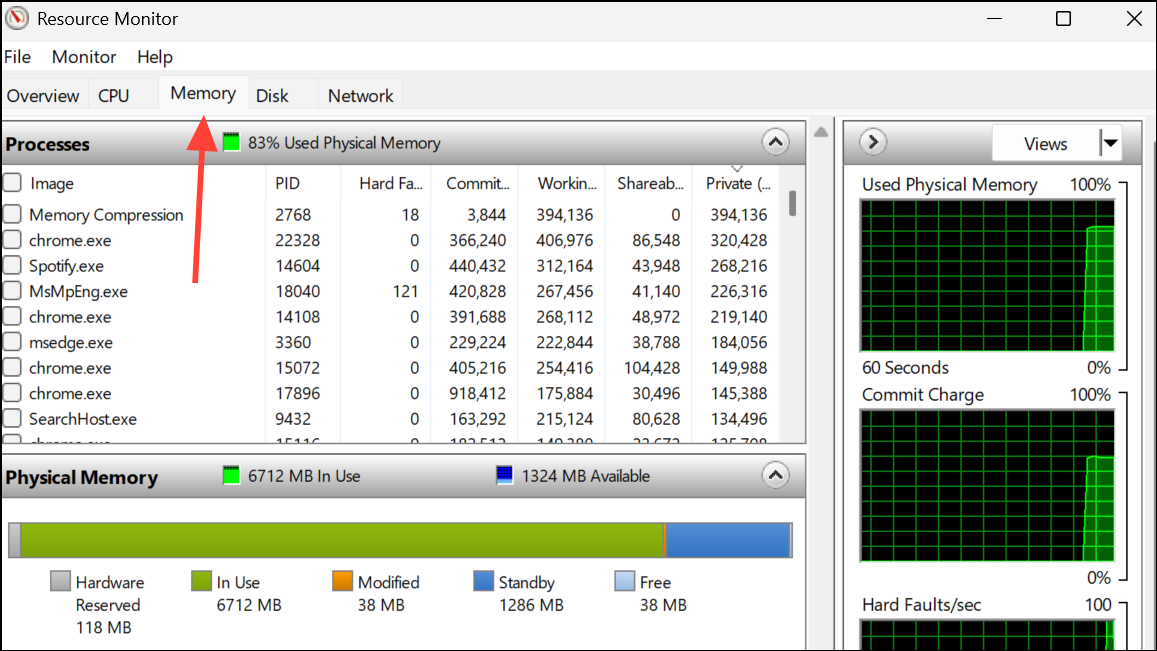
Use Resource Monitor for Additional Insights
Resource Monitor provides another layer of detail, especially when you need to see how memory is allocated among processes and system components.
resmon in the Windows search bar and pressing Enter, or by clicking “Open Resource Monitor” at the bottom of Task Manager’s Performance tab.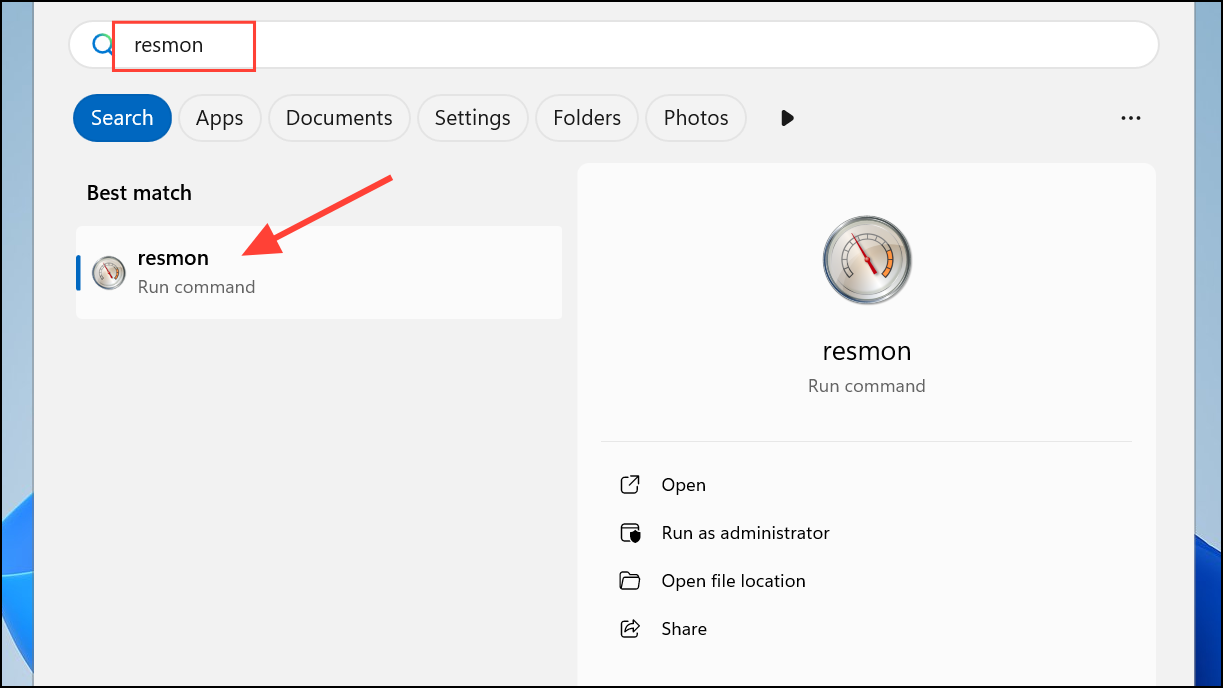
Identify Memory Leaks and Hidden Usage
Sometimes, the sum of all process memory usage does not match the total RAM in use. This discrepancy can be caused by:
- Drivers leaking memory (e.g., network, graphics, or peripheral drivers).
- Background services or virtual machines (such as WSL, Hyper-V, or Android subsystem).
- System cache or standby memory not being released properly.
- Malfunctioning antivirus or security software.
To address these issues:
- Update all device drivers, especially after noticing high memory usage or following Windows updates.
- Check for and close any virtual machines or subsystems not in use.
- Use RAMMap to inspect driver-locked and non-paged pool memory for signs of leaks.
- Restart your PC regularly to clear memory leaks and system cache.
- Monitor which apps are set to run on startup and disable non-essential ones.
In some cases, only a full system restart or driver update will resolve persistent high memory usage caused by leaks or hidden processes.
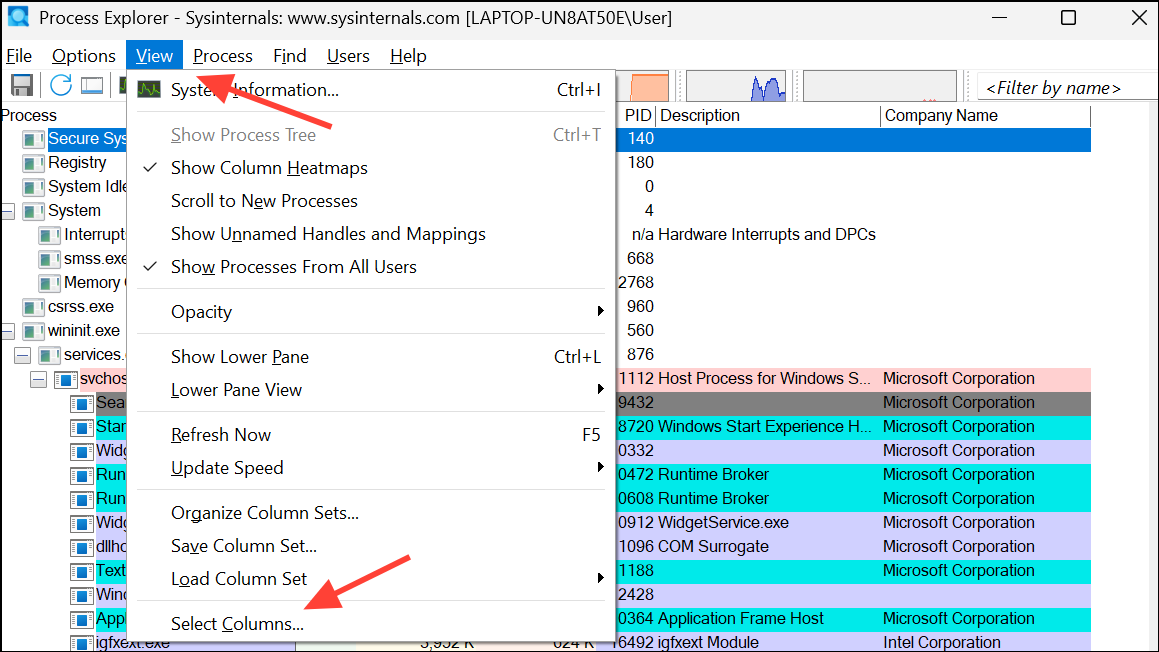
Try Advanced Tools and PowerShell for Deeper Analysis
For advanced troubleshooting, use tools like Sysinternals Process Explorer or PowerShell commands to gather more detailed memory usage data.
Get-WmiObject WIN32_Process | Sort-Object -Property ws -Descending | Select-Object -first 25 ProcessID,Name,WS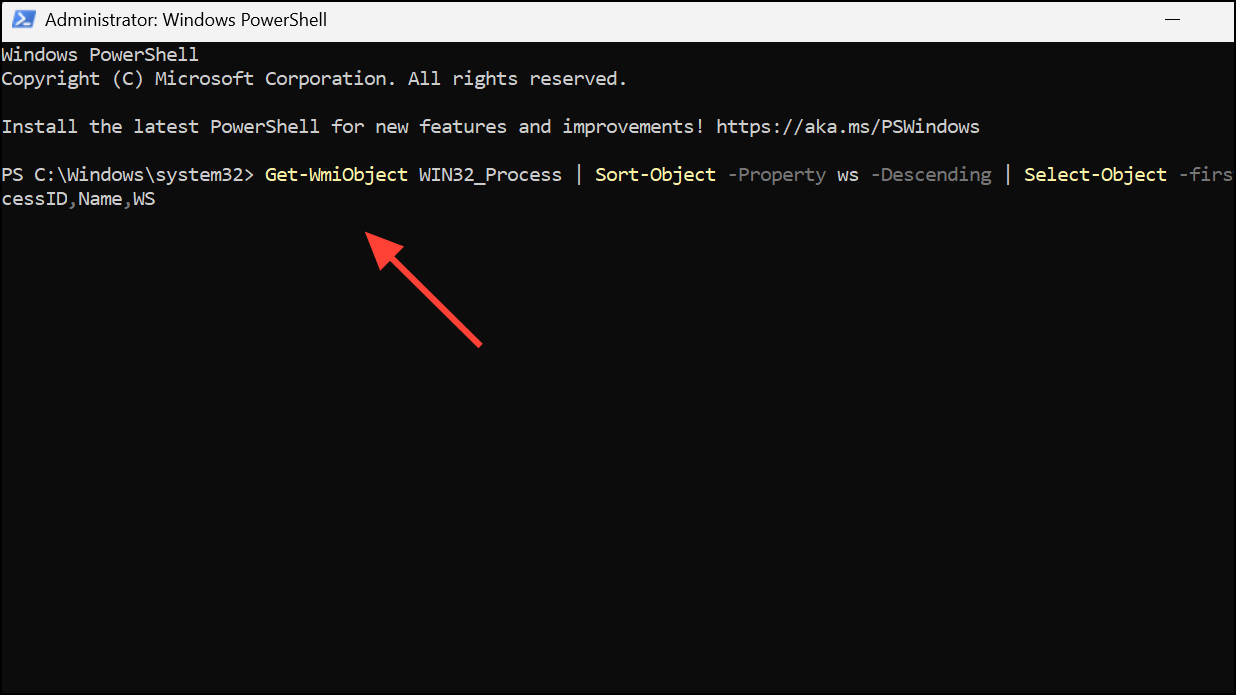
This command lists the top 25 processes by working set (physical memory usage).
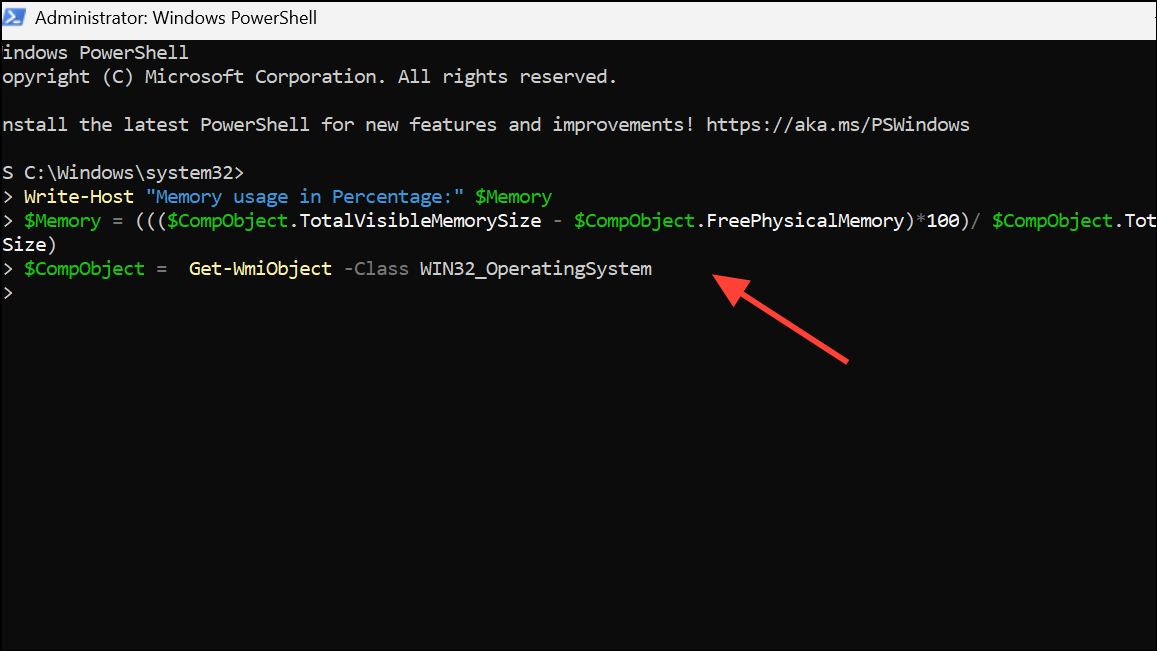
$CompObject =  Get-WmiObject -Class WIN32_OperatingSystem
$Memory = ((($CompObject.TotalVisibleMemorySize - $CompObject.FreePhysicalMemory)*100)/ $CompObject.TotalVisibleMemorySize)
Write-Host "Memory usage in Percentage:" $Memory
These tools and commands help identify memory usage patterns that might not be visible in standard Task Manager views.
Tracking down which programs use the most RAM in Windows 11 often requires more than just a glance at Task Manager. By combining RAMMap, advanced Task Manager views, Resource Monitor, and specialized tools, you can accurately diagnose memory issues and improve your system’s speed and reliability.