Experiencing slowdowns or unexpected crashes during intensive tasks like gaming or video editing can be frustrating. A common culprit behind these issues is the overheating of your graphics card (GPU). Monitoring your GPU temperature is essential to maintain optimal performance and prolong the lifespan of your hardware.
Using Third-Party GPU Monitoring Tools
Several third-party applications provide detailed insights into your GPU’s temperature and performance metrics. These tools often offer more comprehensive data compared to built-in utilities. Here are some recommended options:
MSI Afterburner
MSI Afterburner is a versatile and widely-used utility for monitoring your GPU’s temperature and performance. It supports both NVIDIA and AMD graphics cards and offers features like overclocking and fan speed control.


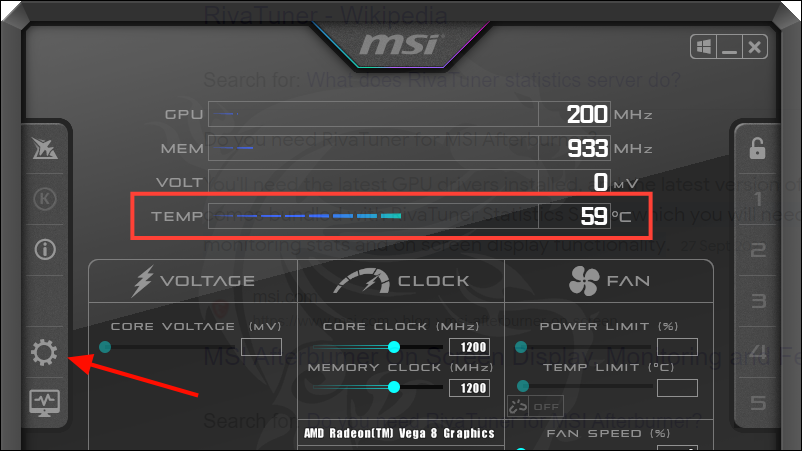
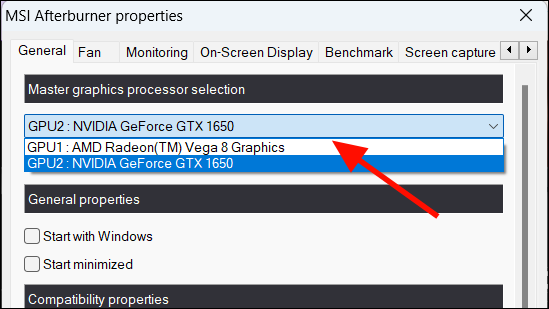
You can now monitor your GPU temperature and adjust settings like fan speed to ensure optimal cooling. Be cautious when tweaking settings to avoid damaging your hardware.
HWiNFO
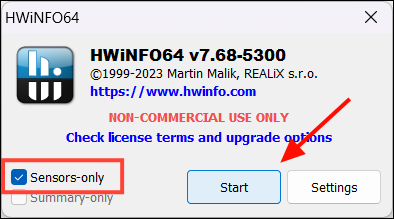
HWiNFO is a comprehensive system information and monitoring tool that provides real-time data on your GPU’s temperature and other hardware metrics. It’s free for personal use and available as a portable version that doesn’t require installation.
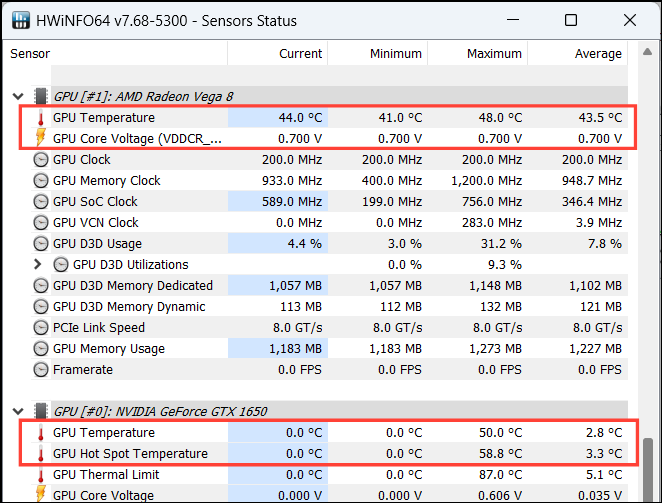
This tool provides extensive details and allows you to customize the interface to display only the sensors you’re interested in.
GPU-Z
GPU-Z is a lightweight utility designed to give you all the information about your video card and GPU. It supports a wide range of GPUs and provides real-time temperature readings.
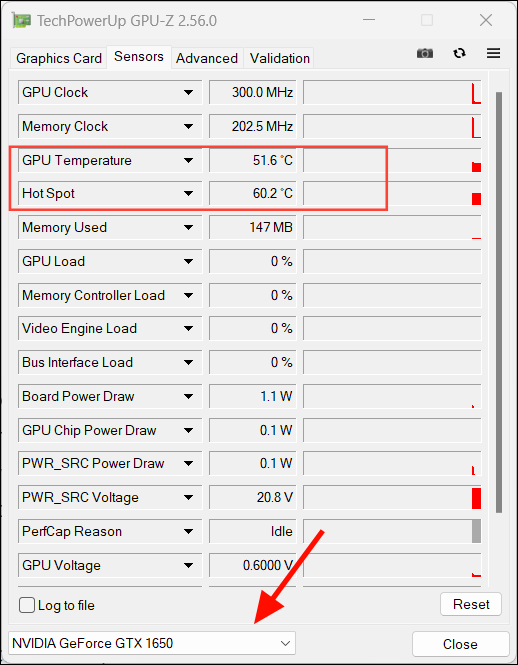
GPU-Z provides detailed information about your graphics hardware and is especially useful for troubleshooting and performance tuning.
Using OEM Software
Graphics card manufacturers offer dedicated software that allows you to monitor and tweak your GPU’s performance. These tools are optimized for their specific hardware and can provide accurate temperature readings.
AMD Graphics Cards
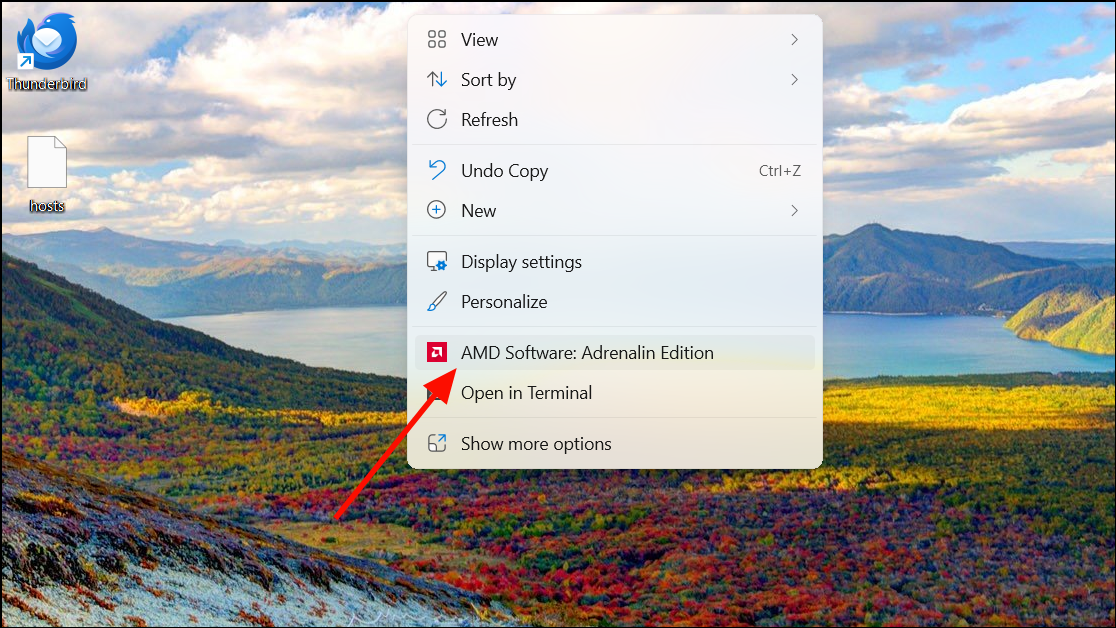
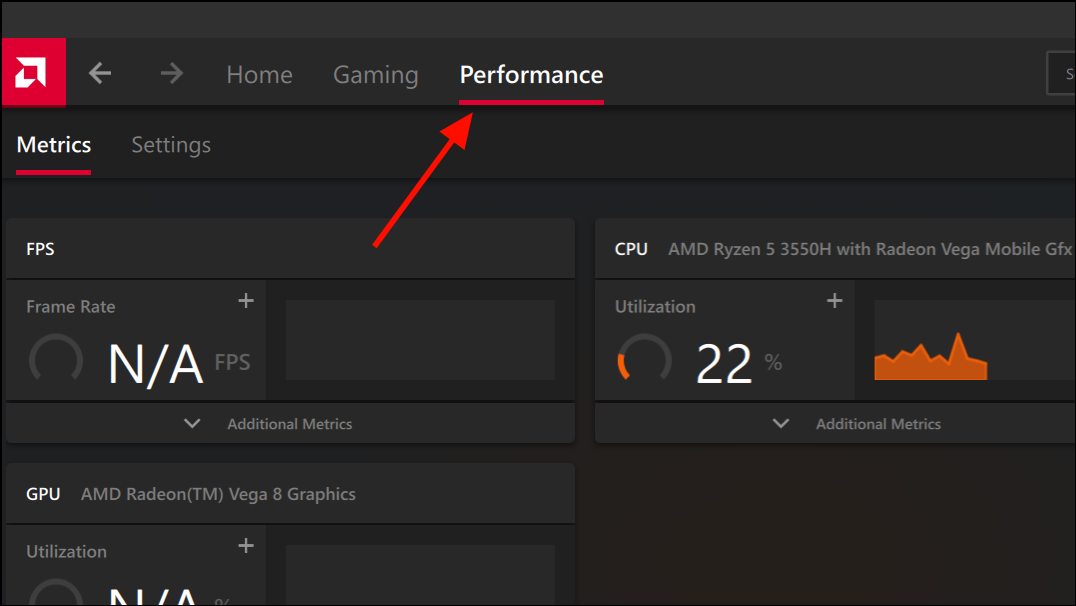
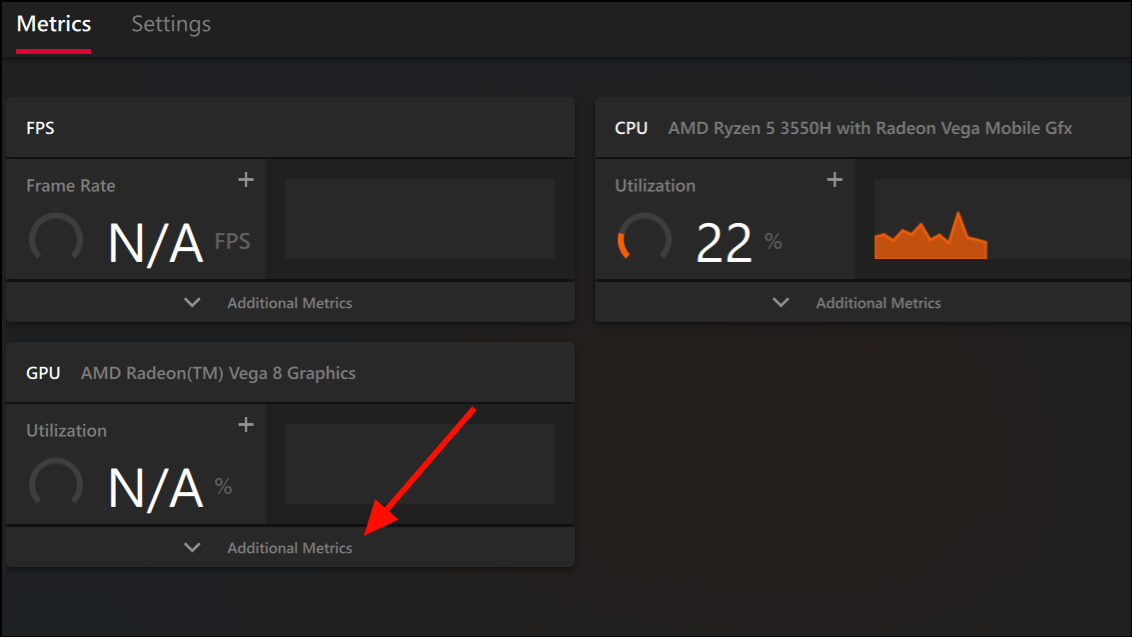
For AMD users, the AMD Adrenalin software is a comprehensive tool for monitoring your GPU temperature and adjusting settings.
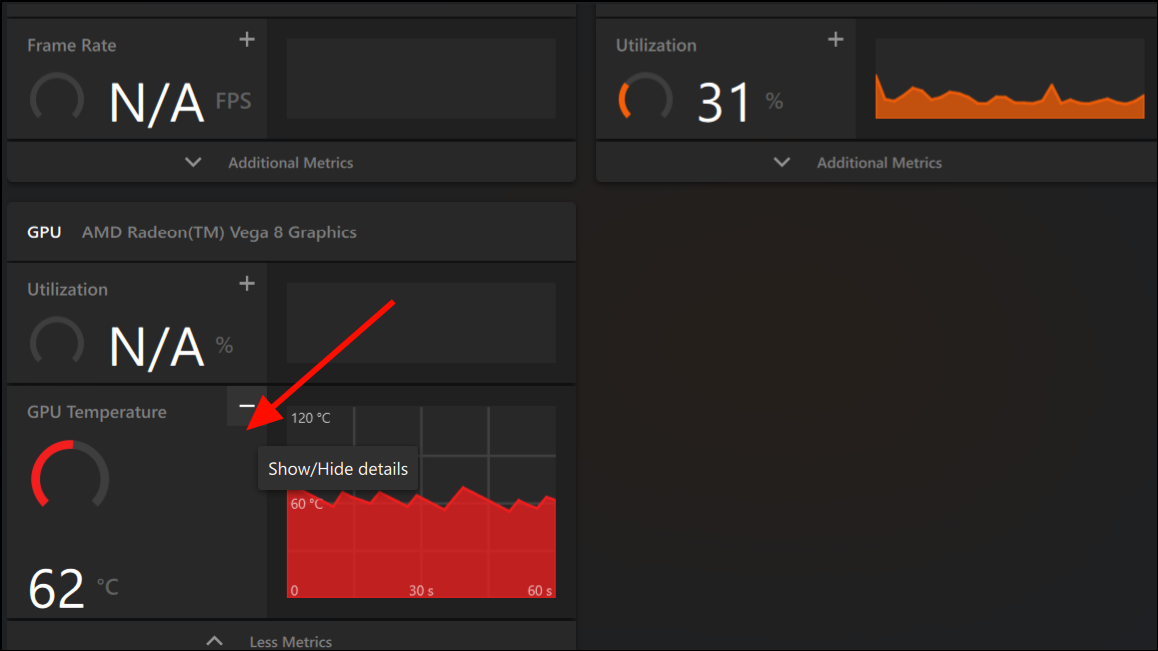
The software also allows you to log data to a CSV file for in-depth analysis and benchmarking purposes.
NVIDIA Graphics Cards
NVIDIA users can utilize the GeForce Experience app to monitor their GPU temperature and performance metrics.
Alt+Z to access it quickly.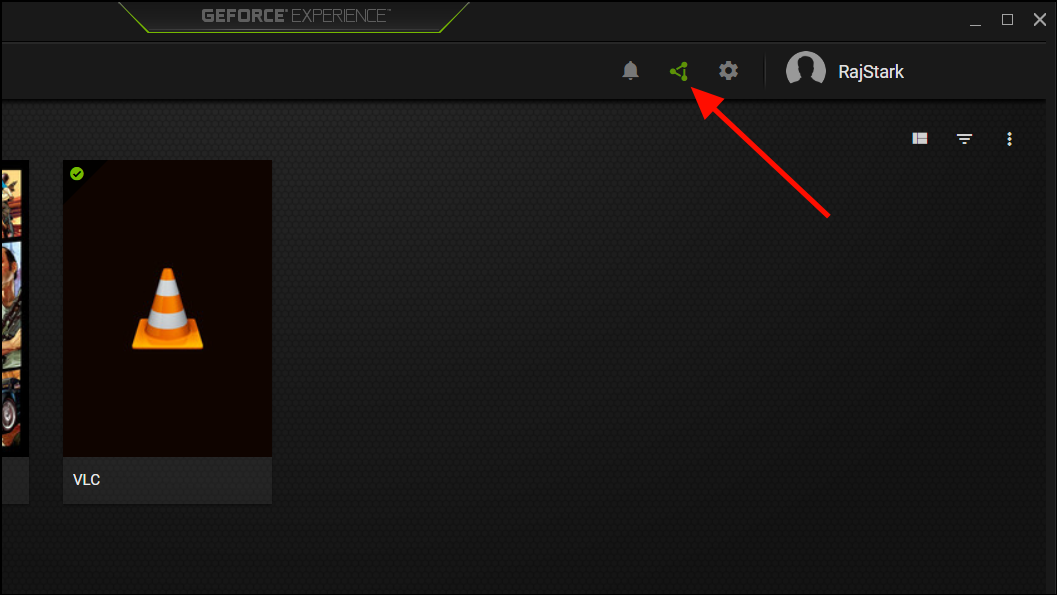
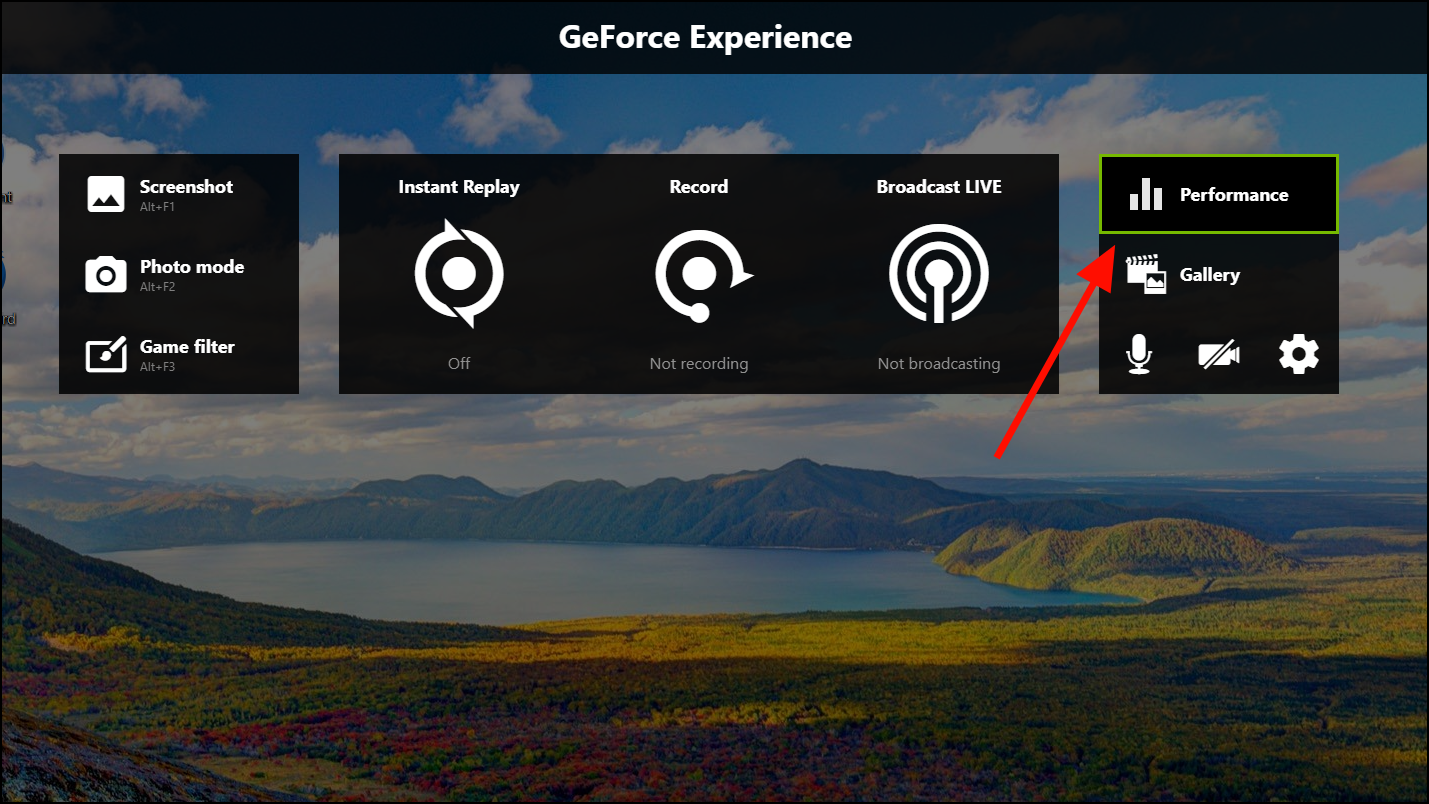
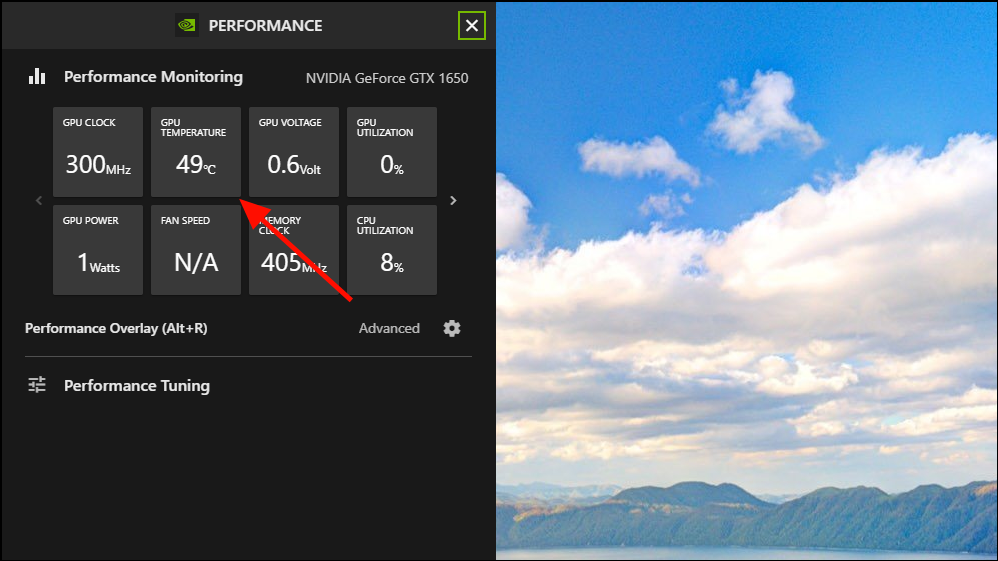
This tool is particularly useful for in-game monitoring without the need to switch out of your application.
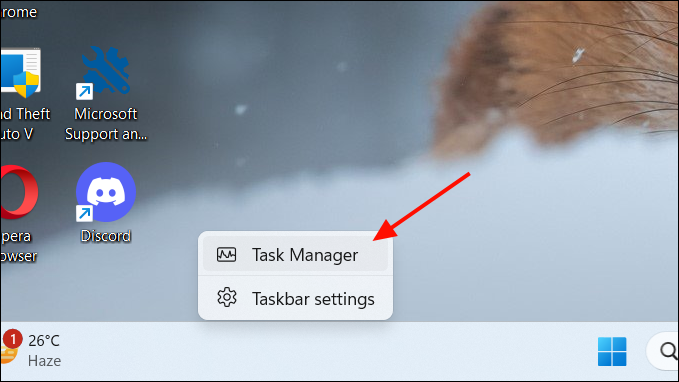
Using Windows Task Manager
Windows 11 includes a built-in feature to check your GPU temperature through the Task Manager. This method provides a quick overview without the need for additional software.
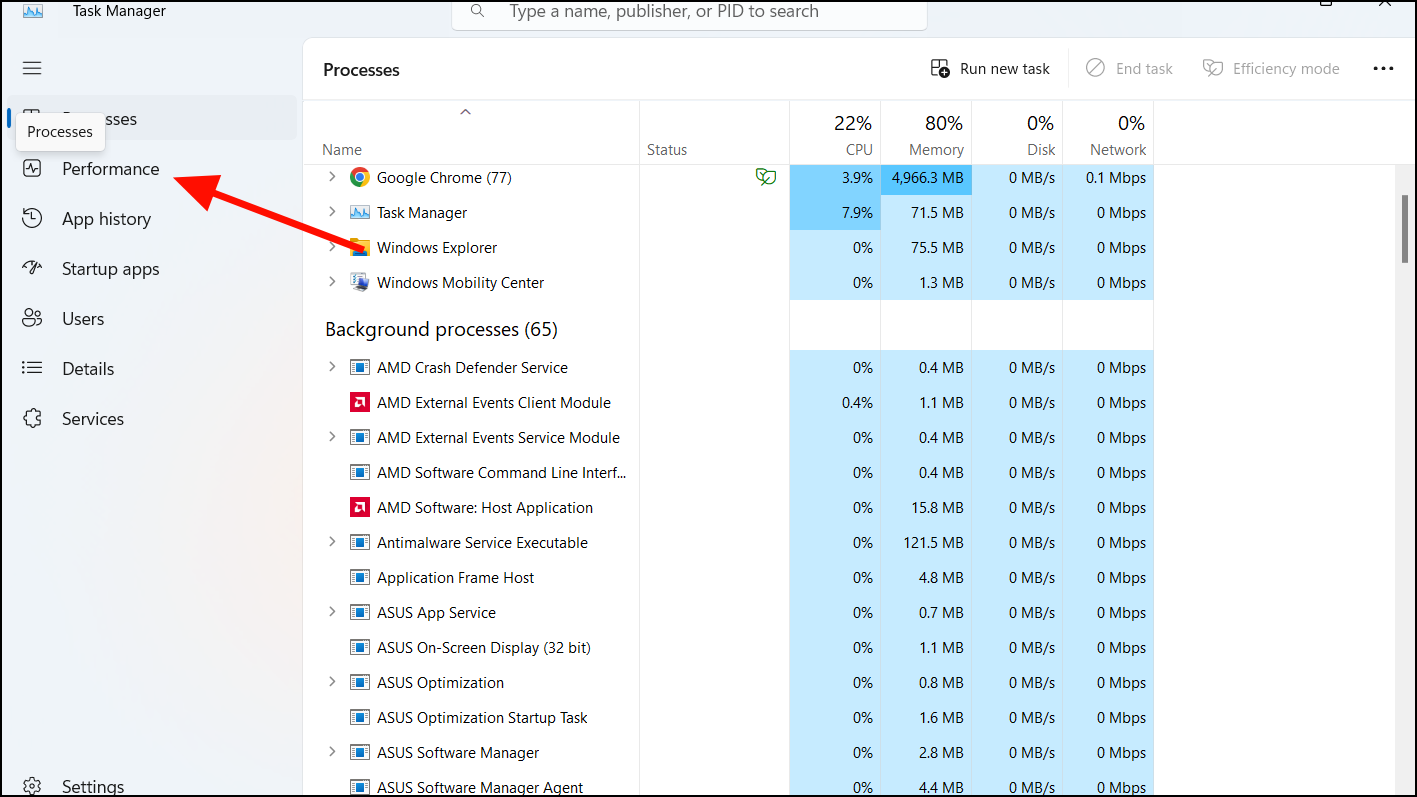
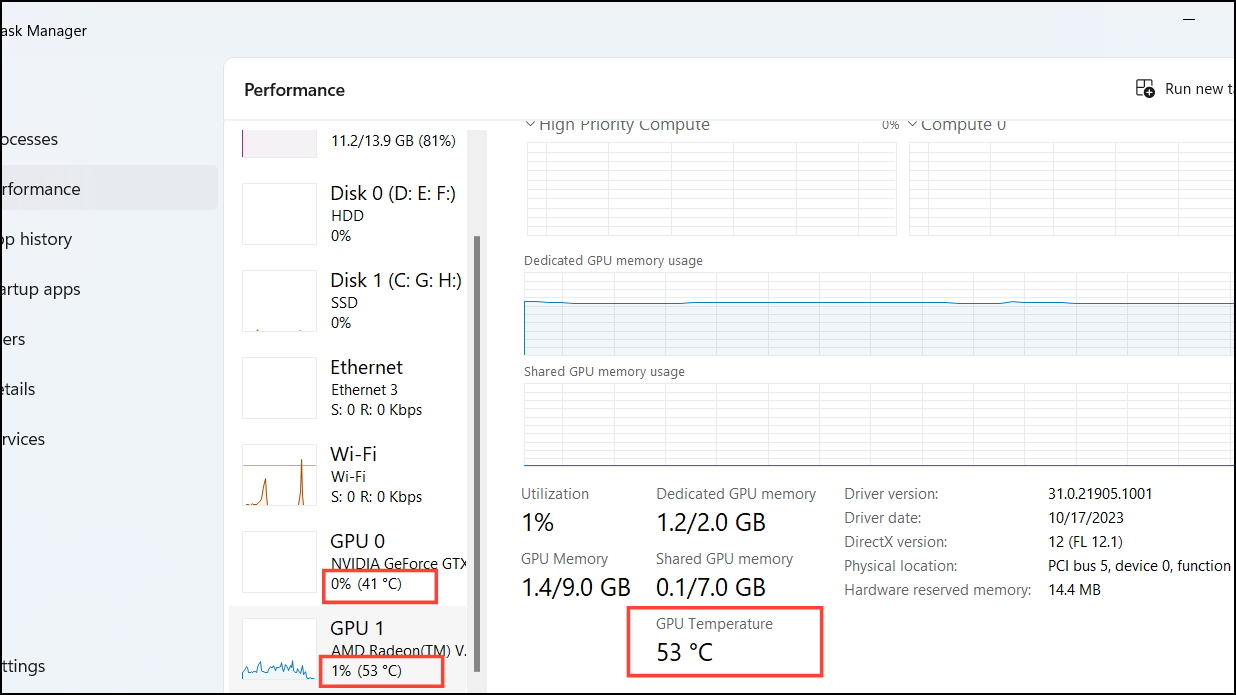
Keep in mind that not all GPUs are compatible with this feature, and you may need updated drivers (WDDM 2.4 or later) for temperature monitoring to work.
What is a Good GPU Temperature?
Optimal GPU temperatures can vary based on the specific model and workload. Generally, temperatures between 50°C and 70°C at idle, and up to 90°C under load are considered acceptable. If your GPU consistently runs hotter than this, it may indicate cooling issues.
To keep your GPU temperature in check, ensure proper airflow in your computer case by cleaning dust and organizing cables. You can also adjust fan speeds or lower graphics settings in demanding applications to reduce the strain on your GPU.